
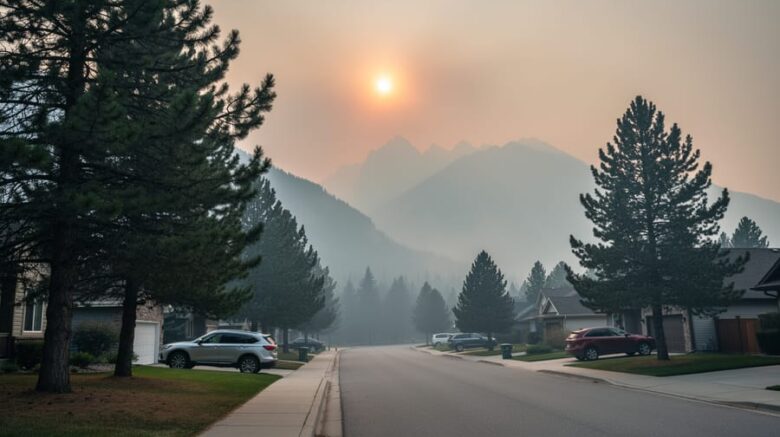
Canmore air quality refers to the concentration of pollutants in the air over this Rocky Mountain town, measured primarily through particulate matter (PM2.5) levels and reported on the Air Quality Health Index (AQHI). For residents and visitors in Canmore, understanding air quality matters most during wildfire season, when smoke from regional fires can blanket the valley and create hazardous breathing conditions within hours.
If you’re searching for Canmore’s air quality right now, you’re probably seeing haze, smelling smoke, or wondering whether it’s safe to go outside. This article breaks down how air quality is monitored in Canmore, what the measurements mean for your health, and where to find real-time data when you need it.
Canmore’s location in the Bow Valley creates unique air quality challenges. The surrounding mountains can trap smoke and pollutants, particularly when wildfire plumes drift in from British Columbia or other parts of Alberta. On clear days, Canmore enjoys some of the cleanest air in North America. During active fire seasons, PM2.5 readings can spike from low single digits to hazardous levels above 250 micrograms per cubic meter in a matter of hours.
The practical reality: checking air quality before heading out for a trail run, deciding whether to keep windows open, or knowing when vulnerable family members should stay indoors can directly protect your respiratory health during smoky periods.
What Is Air Quality and Why Does It Matter in Canmore?
Air quality is a measure of how clean or polluted the air is, based on the concentration of harmful substances, primarily particulate matter, ozone and nitrogen dioxide, that can affect human health and the environment. In Canmore, air quality is measured and forecast using the same systems employed across Canada, including air quality model forecasts that track pollutant levels hour by hour over a 72-hour window.
- Air Quality
- The measure of pollutant concentrations in the atmosphere, indicating how clean or contaminated the air is for breathing.
- PM2.5
- Particulate matter 2.5 microns and smaller, the primary pollutant in wildfire smoke and the key metric used in smoke forecasts. These microscopic particles can penetrate deep into the lungs and bloodstream.
- Ground-Level Ozone (O3)
- A reactive gas formed when other pollutants interact with sunlight, tracked alongside PM2.5 in air quality models.
- Nitrogen Dioxide (NO2)
- A pollutant primarily from vehicle emissions and combustion, monitored as part of comprehensive air quality assessments.
- AQHI
- The Air Quality Health Index, a scale from 1 to 10+ that communicates health risk based on combined pollutant levels and helps residents make informed decisions about outdoor activities.
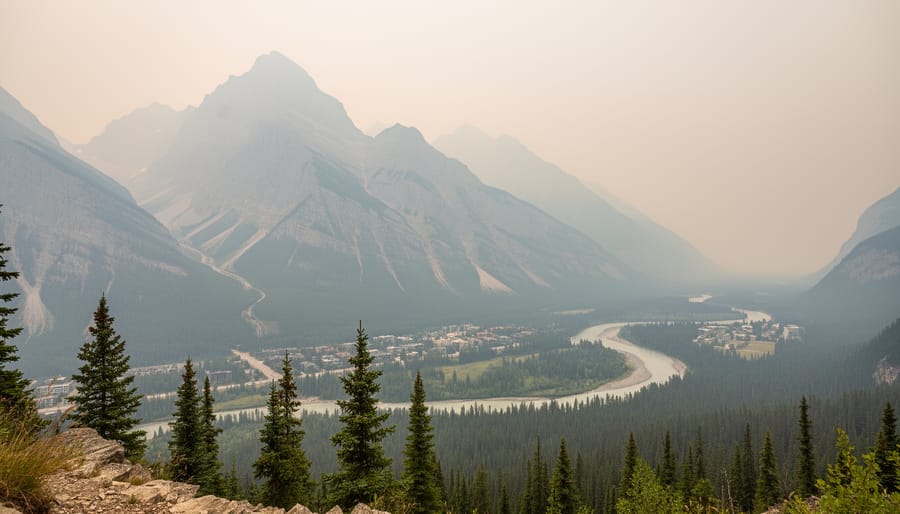
Mountain communities like Canmore face unique air quality challenges that flat-land cities don’t. The Bow Valley’s steep topography creates a natural channel that funnels and traps smoke, while surrounding peaks limit how quickly polluted air can disperse. Wind patterns that normally clear the valley can stall or reverse, holding wildfire smoke in place for hours or days. Cold air can settle into the valley overnight, creating an inversion layer that acts like a lid, preventing smoke from rising and escaping. When wildfires burn in British Columbia or western Alberta, prevailing winds often push smoke directly through the Bow Valley corridor, and Canmore’s location means it catches both local emissions and smoke transported from distant fires. This combination of geography and meteorology means air quality can deteriorate rapidly and persist longer than in open terrain.
How Air Quality Monitoring Works in Canmore
The BlueSky Canada Smoke Forecast System
The BlueSky Canada smoke forecast system runs twice daily to predict when and where wildfire smoke will affect communities across Canada. The July 5, 2026 evening run (forecast ID BSC12CA12-07, generated at 20:00 UTC) used meteorological data from a 12-kilometer grid initialized at 12 UTC to model smoke dispersion. This represents the current best estimate for the next 48 hours, though forecasters emphasize caution when predicting exact smoke movement patterns.
The system tracks ground-level concentration of particulate matter 2.5 microns and smaller (PM2.5), the key metric for wildfire smoke exposure. Environment Canada 72-hour maps display hourly PM2.5 concentrations along with ground-level ozone (O3) and nitrogen dioxide (NO2) for the next three days. These hour-by-hour visualizations show residents how smoke plumes are expected to spread and intensify, allowing people to plan outdoor activities around predicted air quality changes. The maps update continuously as new meteorological data becomes available, making them essential tools for anyone needing to check current conditions or plan ahead during active wildfire seasons.
Real-Time Monitoring and Hourly Updates
Environment and Climate Change Canada’s forecast system generates detailed concentration maps that update hourly for the next 72 hours. These maps track three key pollutants: PM2.5, ground-level ozone, and nitrogen dioxide. Each map displays predicted concentrations across the region, allowing you to see not just current conditions but how air quality will likely change throughout the day and into the coming days.
The hour-by-hour wildfire smoke spread visualization shows exactly when smoke plumes are expected to reach specific areas. You can step through the forecast hour by hour, watching how wind patterns push smoke through mountain valleys or how changing weather might clear the air. This granular approach helps you plan outdoor activities around windows of better air quality rather than writing off entire days.
For Canmore residents during active wildfire seasons, these hourly updates become essential tools. Checking the forecast in the morning might show moderate PM2.5 levels rising to unhealthy ranges by afternoon as smoke moves in from the west. That specificity lets you schedule a hike for early morning or decide to keep children indoors after lunch, making decisions based on actual predicted conditions rather than guesswork.
Types of Air Pollutants Tracked in Canmore
PM2.5: The Primary Wildfire Smoke Pollutant
PM2.5 refers to tiny particles suspended in the air that measure 2.5 micrometers or smaller, about 30 times finer than a human hair. These microscopic particles penetrate deep into the lungs and can even enter the bloodstream, making them the most health-relevant pollutant during wildfire events. Environment and Climate Change Canada uses PM2.5 in smoke forecasts as the primary indicator because wildfire smoke contains concentrated levels of these fine particles.
During active smoke events, PM2.5 concentrations are measured in micrograms per cubic meter of air. Ground-level monitoring stations track these readings hourly, while forecast models predict how concentrations will shift based on smoke plume movement and atmospheric conditions. Unlike larger particles that settle quickly, PM2.5 can remain airborne for days and travel hundreds of kilometers from the fire source, which is why Canmore residents often experience poor air quality even when wildfires burn far from the town itself.
Ground-Level Ozone and Nitrogen Dioxide
While PM2.5 dominates headlines during wildfire events, air quality forecasts also track ozone and nitrogen dioxide because these gases affect overall respiratory health. Ground-level ozone forms when sunlight reacts with pollutants from vehicles and industry, creating a lung irritant that peaks on hot, sunny days, exactly the conditions that often accompany wildfire smoke. Nitrogen dioxide, released primarily from vehicle exhaust and industrial combustion, inflames airways and worsens asthma. Though wildfire smoke’s particulate matter typically drives Canmore’s poor air quality episodes, these secondary pollutants factor into the Air Quality Health Index, which combines all three measurements into a single risk number. Understanding this helps explain why air quality advisories sometimes persist even after visible smoke clears.
How Wildfire Smoke and Wind Patterns Impact Canmore
Wildfire smoke doesn’t simply drift in a straight line from the fire to Canmore. The journey involves complex interactions between atmospheric conditions, terrain, and weather systems that can concentrate pollutants in mountain valleys for days.
When fires burn, they release massive plumes of particulate matter, carbon monoxide, and other pollutants into the atmosphere. These particles, especially PM2.5, can travel hundreds or even thousands of kilometres depending on wind direction and speed at different atmospheric levels. Upper-level winds might carry smoke from distant fires across provinces, while lower-level winds determine where that smoke descends to ground level.
Canmore’s location in the Bow Valley creates a natural funnel for air movement. Mountain valleys act like channels that guide wind flow, but they also trap air under certain conditions. When high-pressure systems settle over the Rockies or temperature inversions form, where warm air sits above cooler air near the ground, smoke particles get trapped near the surface instead of dispersing upward. The surrounding peaks block horizontal movement, turning the valley into a temporary holding basin for pollutants.
Wind patterns shift constantly. Morning winds might push smoke east through the valley, while afternoon thermal currents could reverse the flow or lift particles higher. These changing conditions explain why BlueSky Canada smoke forecasts use meteorological models with 12km grid resolution and update runs regularly. The system tracks PM2.5 concentrations hour by hour precisely because smoke behaviour in mountainous terrain resists simple prediction.
Forecasters exercise caution when predicting smoke movement because small changes in wind speed, temperature gradients, or precipitation can dramatically alter where and how densely smoke settles. A shift of just a few degrees in wind direction might mean the difference between clear skies and hazardous air quality.
Uses of Air Quality Data for Canmore Residents
Canmore residents, visitors, and local organizations rely on air quality data in several practical ways, especially during wildfire smoke events. The BlueSky forecast and hourly concentration maps inform daily decisions ranging from outdoor recreation planning to public health interventions.
For individuals and families, checking the PM2.5 forecast before heading outdoors helps determine whether it’s safe to hike, bike, or let children play outside. When concentrations are forecast to spike in the evening or overnight, residents can plan outdoor activities for morning hours when air quality typically improves. Athletes training at altitude use the 72-hour forecast to reschedule workouts around poor air quality windows, since breathing heavily in smoky conditions increases pollutant exposure.
- Planning outdoor activities and recreation around forecasted PM2.5 concentration windows
- Timing essential errands and commutes to avoid peak smoke hours
- Deciding when to keep windows closed and run air purifiers indoors
- Determining whether vulnerable family members should stay inside
- Adjusting physical activity intensity based on current pollutant levels
Health professionals and care facilities use air quality data to protect patients with respiratory conditions, heart disease, and compromised immune systems. Local clinics may postpone outdoor therapy sessions or advise patients to refill medications early when prolonged poor air quality is forecast. Schools and daycare centers check the hourly maps to decide whether to keep children indoors during recess.
Tourism operators and outdoor guides monitor the forecasts to communicate conditions with clients and adjust itineraries. A multi-day backcountry trip may be rescheduled if the 72-hour forecast shows sustained poor air quality, while rafting companies can shift launch times to morning hours when smoke concentrations are lower. Emergency services also use the data to allocate resources and prepare for increased respiratory distress calls during smoke events.
Common Questions About Canmore Air Quality
What pollutants are tracked in air quality forecasts for Canmore?
The primary metric is particulate matter 2.5 microns and smaller (PM2.5), which is the key measurement used in BlueSky Canada smoke forecasts. Environment and Climate Change Canada’s hourly forecast maps also track ground-level ozone (O3) and nitrogen dioxide (NO2) concentrations over the next 72 hours.
How does wildfire smoke spread hour by hour?
Smoke movement maps show expected dispersion patterns based on wind direction, atmospheric conditions, and topography. These hourly visualizations help residents anticipate when smoke will arrive in their area and when conditions might improve, though predictions become less certain beyond 48 hours.
Why might air quality monitors miss some wildfire smoke events?
Fixed monitoring stations only measure conditions at their specific locations, and smoke can move through valleys and be influenced by local wind patterns without passing directly over a station. This is why forecast models that account for wind patterns and terrain provide important complementary information to ground-based measurements.
Why do smoke forecasts emphasize caution when predicting movement?
Wildfire smoke behavior is difficult to predict precisely because it depends on multiple changing factors: fire intensity, wind speed and direction at different altitudes, temperature inversions, and how mountain topography channels or traps air masses. Forecasters build in caution because unexpected wind shifts can quickly change where smoke concentrates.
Understanding these limitations helps you use air quality information more effectively. The BlueSky forecast run from July 5, 2026 at 20:00 UTC represents the most current prediction available, but checking multiple sources and staying alert to changing conditions remains important during active wildfire smoke events.
When you notice differences between what the forecast predicted and what you’re experiencing outside, that’s not necessarily an error. It reflects the inherent challenge of modeling how smoke moves through complex mountain terrain. Your own observations, reduced visibility, smoke smell, breathing difficulty, are valid data points that should inform your protective decisions regardless of what the forecast shows.
What You Can Do to Monitor and Protect Your Health
Start your day by checking the BlueSky Canada smoke forecast, which updates twice daily and provides 72-hour predictions of PM2.5 concentrations. Visit Environment and Climate Change Canada’s air quality forecast maps to see hourly concentration updates for PM2.5, ground-level ozone, and nitrogen dioxide. These tools show you not just current conditions but how smoke is expected to move hour by hour, helping you plan outdoor activities around clearer air windows.
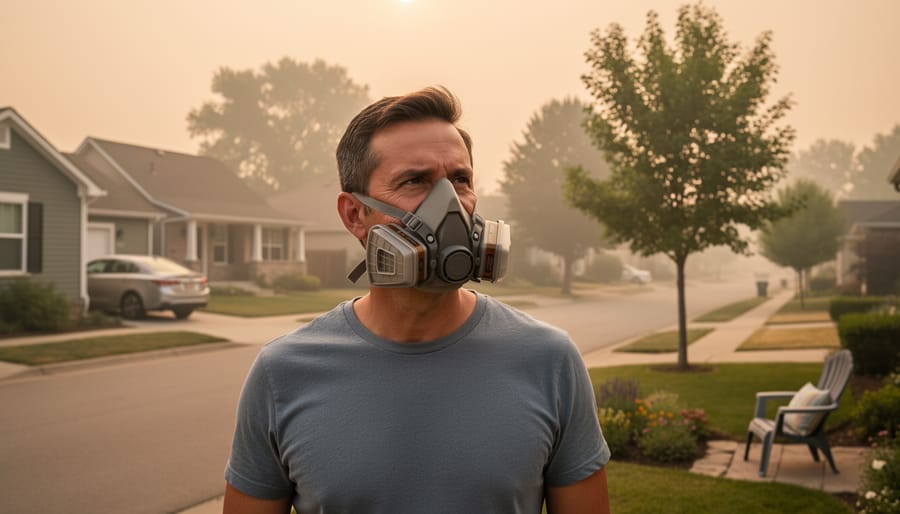
When air quality deteriorates, limit your time outdoors, especially during early morning and evening when smoke often settles in valleys. Move vigorous exercise indoors or reschedule it for days with better air quality. If you must be outside, reduce intensity and duration. Keep windows and doors closed, and use portable air purifiers with HEPA filters in the rooms you spend the most time in. Those with respiratory conditions, older adults, children, and pregnant individuals should be particularly cautious.
Understanding health advisories matters. When you see PM2.5 readings above 50 micrograms per cubic meter on the forecast maps, that signals moderate to high risk. Learn to interpret these numbers so you can make informed decisions about outdoor activities rather than relying on how the sky looks.
Join community awareness efforts by sharing accurate air quality information with neighbors who may not know about these forecasting tools. Support local climate action initiatives and advocate for renewable energy policies that address the root cause of increasing wildfire frequency. Climate change drives longer, more intense fire seasons, making these smoke events more common. Your voice matters in pushing for solutions that reduce long-term risks.
Stay informed, check forecasts daily during fire season, and recognize that protecting your immediate health and supporting broader climate solutions go hand in hand.
Types or components
Canmore’s air quality monitoring systems track three distinct components that determine overall air safety during wildfire smoke events. Particulate matter (PM2.5) forms the core measurement, microscopic particles 2.5 microns and smaller that penetrate deep into lungs and bloodstreams. Ground-level ozone (O3) represents a secondary pollutant created when sunlight reacts with emissions, often intensifying during warm afternoons. Nitrogen dioxide (NO2) rounds out the trio, primarily from combustion sources that include both wildfires and vehicle emissions.
The BlueSky Canada forecast integrates these three pollutants into 72-hour concentration maps, updating hourly to show how smoke spreads across the Bow Valley. Each component requires different protective measures: PM2.5 demands indoor air filtration during heavy smoke days, while ozone warnings typically mean postponing outdoor exercise during peak afternoon hours. Understanding these distinct pollutants helps residents make informed decisions about when to venture outside and when to stay indoors.
Addressing wildfire frequency connects directly to Canada’s energy transition and the wind energy benefits that reduce climate-warming emissions driving longer, more intense fire seasons.
Understanding air quality in Canmore matters more than ever. The tools available today, from the BlueSky Canada smoke forecast to hourly PM2.5 concentration maps, give residents real-time information to make informed decisions about outdoor activities and health protection. When wildfire smoke rolls into the valley, these systems provide crucial early warnings that weren’t available a decade ago.
The broader picture connects Canmore’s smoke events to climate patterns driving longer fire seasons and more intense summer extreme weather across Western Canada. Addressing wildfire frequency means tackling the root causes of climate change. Supporting renewable energy development, reducing fossil fuel dependence, and advocating for policies that accelerate Canada’s net-zero journey all play a role in reducing long-term wildfire risks.
Check air quality forecasts regularly during fire season, understand what PM2.5 levels mean for your health, and adjust your activities accordingly. Share reliable information with neighbours, especially those in vulnerable groups. The combination of individual awareness and collective action on climate solutions gives Canmore the best chance at clearer skies ahead.