

Current air quality refers to the concentration of pollutants and particulate matter in the atmosphere at this moment, measured and reported through standardized health indices that tell you whether the air outside is safe to breathe. In Canada, Environment and Climate Change Canada tracks these conditions through the Air Quality Health Index (AQHI), a scale from 1 to 10+ that translates complex pollution data into clear health risk categories: low, moderate, or high.
Right now, air quality varies dramatically across the country, and wind patterns are the primary reason why. Cities like Fort Smith are experiencing high-risk conditions with an AQHI of 10, while communities on the Atlantic coast, including Halifax, Fredericton, and Charlottetown, all register low-risk readings of 2. Calgary and Edmonton sit in the middle at moderate risk with readings of 6. These regional differences aren’t random. Prevailing winds carry pollutants and wildfire smoke across vast distances, concentrating them in some areas while clearing others.
Understanding what these numbers mean for your daily activities matters more than ever. The AQHI doesn’t just measure abstract pollution levels. It provides actionable guidance: whether to reschedule outdoor exercise, keep children inside, or adjust your commute. For those managing respiratory conditions like asthma or COPD, checking current air quality before stepping outside can prevent serious health episodes.
This article explains how the AQHI works, what factors beyond wildfires influence local readings, and specific steps to take when air quality deteriorates in your region. You’ll learn to interpret real-time data and make informed decisions that protect your health and your family’s wellbeing.
What the Air Quality Health Index Means
The Air Quality Health Index is a numbered scale that translates complex air pollution data into a single, easy-to-understand health risk rating. Developed by Environment and Climate Change Canada in partnership with Health Canada, the AQHI scale from 1-10+ doesn’t just measure how dirty the air is, it tells you how much that pollution might affect your health today.
Rather than reporting individual pollutant levels that mean little to most people, the AQHI combines measurements of ground-level ozone, particulate matter, and nitrogen dioxide into one number that reflects their combined health impact. A reading of 3 means something very different for your daily plans than a reading of 9, and the system is specifically designed so you don’t need a science degree to interpret it.
The scale breaks down into four distinct risk categories, each with clear implications for outdoor activities:
- Low Risk (1-3)
- Air quality poses minimal health risk. Ideal conditions for outdoor activities for everyone, including children, the elderly, and those with respiratory conditions.
- Moderate Risk (4-6)
- Air quality is acceptable for most people, but unusually sensitive individuals may experience mild symptoms during prolonged or intense outdoor exertion.
- High Risk (7-10)
- People with heart or breathing problems, older adults, children, and pregnant individuals should reduce outdoor physical activity. The general population may also notice effects during strenuous activities.
- Very High Risk (10+)
- Everyone should reduce or reschedule outdoor activities, especially strenuous ones. People with existing health conditions should stay indoors and keep activity levels low.
The genius of this system lies in its simplicity. When Calgary registers a 6, you know immediately that sensitive groups should take it easy outdoors. When Fort Smith hits 10, the message is clear: everyone needs to adjust their plans. This standardized approach means the same number carries the same health guidance whether you’re in Halifax or Edmonton, making it easy to compare conditions across regions and make informed choices about your day.
How the Air Quality Health Index Works
The Air Quality Health Index runs on a network of monitoring stations across Canada that continuously sample outdoor air and measure concentrations of three key pollutants: ground-level ozone, fine particulate matter (PM2.5), and nitrogen dioxide. Automated instruments draw in air samples and use chemical sensors and light-scattering technology to quantify each pollutant in real time. These stations typically sit in urban areas, industrial zones, and representative locations that reflect where people live and work, ensuring the data captures actual exposure conditions.
- Ground-level ozone (O3) forms when sunlight reacts with vehicle emissions and industrial pollutants, peaking on hot, sunny days
- Fine particulate matter (PM2.5) comes from combustion sources like vehicle exhaust, industrial smokestacks, and wildfire smoke
- Nitrogen dioxide (NO2) originates primarily from vehicle emissions and fossil fuel burning in power plants and factories
Once the monitoring equipment records pollutant concentrations, Environment and Climate Change Canada applies a formula that converts those measurements into a single AQHI number. The formula calculates excess mortality risk based on epidemiological studies linking pollutant levels to hospital admissions and deaths. Rather than simply averaging concentrations, it weights each pollutant according to its health impact and produces a number that reflects combined risk. A reading of 3 means low risk, while 7 signals high risk, giving the public a straightforward health message without needing to interpret three separate pollutant values.
Monitoring stations transmit data to regional centres every hour, and the national system updates current AQHI values hourly throughout the day. Forecasters combine this real-time data with weather models, emission inventories, and atmospheric chemistry predictions to generate forecasts for the next 24 to 48 hours. These forecasts account for expected wind patterns, temperature changes, and known pollution sources, projecting how air quality will shift as conditions evolve.
The distinction between current readings and forecasts matters for practical decision-making. Current AQHI values reflect what monitoring stations measured in the past hour, telling you the air quality right now in that specific location. Forecasts predict what the AQHI will be later today or tomorrow based on expected weather and emission patterns, helping you plan outdoor activities or adjust travel routes before conditions worsen. A forecast might show moderate risk this morning improving to low risk by afternoon as winds pick up, or the reverse if a weather system stalls over the city.
Local assessment relies on multiple stations within a region, each capturing neighbourhood-scale variations caused by traffic corridors, industrial facilities, or geographic features like valleys that trap pollutants. Urban centres often have several stations to account for these differences, while rural areas may depend on a single representative site.
How Wind Patterns Influence Air Quality

Wind Speed and Pollutant Dispersion
Wind speed acts as nature’s ventilation system for our atmosphere. When winds pick up, they create turbulence that mixes pollutants vertically and horizontally, spreading them across a larger volume of air. This dilution effect reduces concentrations at ground level, where we breathe. Strong breezes can lower pollution levels within hours by carrying contaminants away from their sources and dispersing them into the upper atmosphere. Understanding how wind works helps explain why the same emission sources create vastly different air quality conditions depending on weather patterns.
Calm conditions produce the opposite effect. When wind speeds drop below 5 kilometers per hour, pollutants accumulate near their sources like a slow-filling basin. Vehicle exhaust, industrial emissions, and heating systems release contaminants that hover in place rather than dispersing. This stagnation is particularly noticeable in urban valleys and bowl-shaped cities where geography restricts air movement. A typical example occurs during winter temperature inversions in prairie cities: cold, heavy air settles at ground level, trapping vehicle emissions and wood smoke beneath a warmer air layer above. Residents wake to hazy skies and elevated AQHI readings that persist until afternoon winds arrive to flush out the accumulated pollutants.
Wind Direction and Regional Transport
Wind direction determines whether you’re breathing clean ocean air or smoke from fires burning hundreds of kilometers away. In Canada, prevailing westerly winds typically draw marine air from the Pacific Ocean across British Columbia and into the Prairies, bringing relatively clean conditions. These west-to-east flows explain why coastal cities often enjoy lower AQHI readings, similar to today’s Low Risk status in Maritime provinces benefiting from Atlantic influences.
When winds shift to easterly or northerly patterns, they carry very different air masses. Continental air from inland regions can transport industrial emissions, agricultural dust, and urban pollution across provincial boundaries. During wildfire season, northerly and westerly winds become particularly problematic, pushing smoke plumes from northern forests southward and eastward across populated areas. This transport phenomenon explains why Fort Smith currently registers High Risk while cities to the east show Moderate or Low Risk readings.
The direction matters as much as the speed. A strong westerly wind might clear smoke from Alberta within hours, while a persistent easterly flow can trap pollutants against mountain ranges, creating multi-day episodes of poor air quality across entire regions.
Current Air Quality Across Canadian Cities Today
Today’s air quality readings reveal a clear east-to-west gradient across Canada that demonstrates how wind patterns transport pollutants over vast distances. Local AQHI readings show Fort Smith in the Northwest Territories registering the highest risk at 10, classified as High Risk. Meanwhile, Calgary and Edmonton both sit at 6 (Moderate Risk), while the Maritime provinces enjoy much cleaner air: Charlottetown, Fredericton, and Halifax all report 2 on the scale, indicating Low Risk.
This pattern isn’t random. Fort Smith’s elevated reading reflects its position in the path of wildfire smoke plumes that prevailing westerly and northwesterly winds carry across the northern territories and western provinces. The same air mass affects Alberta’s major cities, though pollutant concentrations have diluted somewhat by the time smoke reaches Calgary and Edmonton, dropping them to moderate levels. Similar patterns affect Canmore air quality in the Rocky Mountain region when smoke settles in mountain valleys.
The Maritime provinces tell a different story. Atlantic Canada benefits today from easterly maritime air flow bringing clean ocean air inland. The persistent sea breeze acts as a natural scrubber, sweeping away local pollutants and preventing the accumulation of particulates from distant sources. This regional contrast perfectly illustrates how wind direction determines air quality: western regions receive continental air masses that have picked up smoke and pollutants along their path, while eastern provinces draw from the relatively pristine Atlantic atmosphere.
These daily variations underscore why checking your local AQHI matters more than relying on national averages or yesterday’s forecast.
How Wildfire Smoke Affects Air Quality
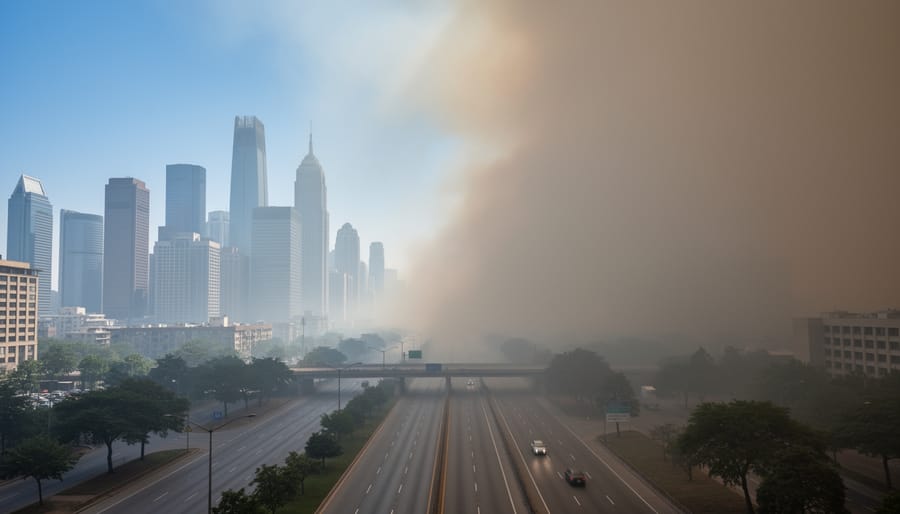
Wildfire smoke ranks among Canada’s most significant air quality threats, particularly during summer months when forest fires peak across the country’s vast boreal regions. The smoke consists primarily of fine particulate matter smaller than 2.5 micrometers (PM2.5), which penetrates deep into lungs and can enter the bloodstream. These microscopic particles carry toxic compounds from burning vegetation, creating serious health risks even for people hundreds of kilometers from the actual fire.
Wind patterns determine where and when wildfire smoke impacts communities. Strong upper-level winds can transport smoke plumes across entire provinces in a single day, while shifting wind directions suddenly redirect smoke from clear areas into populated centers. A fire burning in northern Alberta can blanket Edmonton in haze within hours if winds shift eastward, then push that same smoke toward Saskatchewan by the following day. The dramatic regional differences visible in current AQHI readings across Canada often reflect these smoke transport patterns combined with local pollution sources.
Wildfire smoke creates sudden, severe AQHI spikes because PM2.5 concentrations can jump from safe levels to hazardous within hours. Unlike urban pollution that builds gradually, smoke arrives in dense plumes that overwhelm normal air quality. This rapid onset catches people unprepared, making an air quality alert system essential for public protection. Health impacts include respiratory irritation, reduced lung function, aggravated asthma, and increased cardiovascular stress. Vulnerable groups face the highest risk: children breathe faster and spend more time outdoors, elderly individuals have compromised respiratory systems, and people with existing heart or lung conditions experience symptom flares.
Environment Canada calculates smoke forecasts by combining satellite fire detection data, plume dispersion models, and meteorological predictions. Their FireWork system tracks active fires, estimates smoke emission rates, and projects how wind patterns will carry pollution across the country over the next 48 hours. These specialized smoke forecast tools appear alongside standard AQHI predictions on Environment and Climate Change Canada’s website, providing advance warning that helps Canadians plan outdoor activities and take protective measures before smoke arrives.
Using Air Quality Information in Daily Life
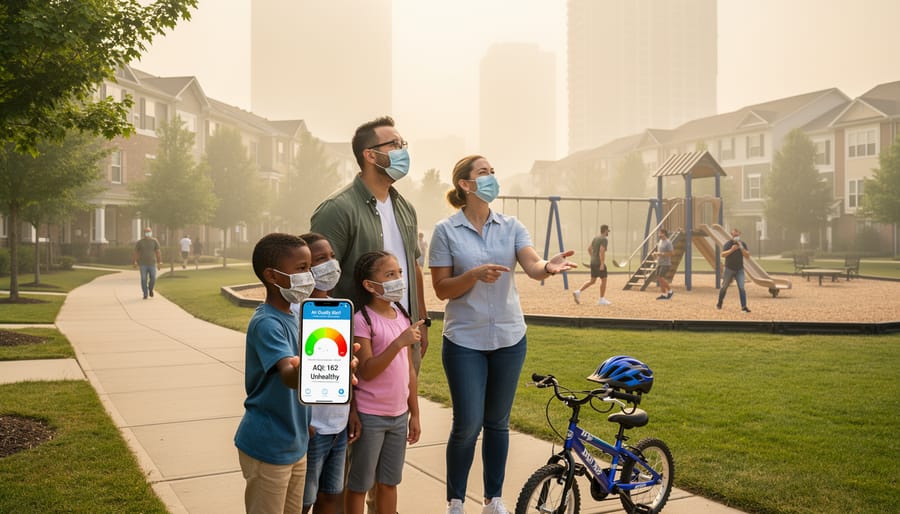
Checking the AQHI before you head outdoors is as simple as visiting Environment and Climate Change Canada’s Air Quality Health Index page, which displays current conditions and forecasts for cities across the country. The site updates regularly with the most recent forecast values, letting you plan your day around air quality just as you would around rain or snow. You can also access detailed local conditions, wildfire smoke predictions, pollutant breakdowns, and educational tool kits that explain what the numbers mean for your health.
Once you know your local AQHI level, you can adjust your activities accordingly. Environment Canada provides specific health risk messages for each category:
- Low Risk (1-3): Ideal for all outdoor activities; no precautions needed for the general population.
- Moderate Risk (4-6): People with respiratory or heart conditions should consider reducing prolonged or intense outdoor exertion if they experience symptoms.
- High Risk (7-10): Children, seniors, and those with health conditions should reduce outdoor physical activity; everyone else should consider limiting prolonged exertion.
- Very High Risk (10+): Everyone should avoid strenuous outdoor activities; vulnerable groups should stay indoors with windows closed.
Real-world application makes these guidelines concrete. If you’re planning a morning run in Calgary and the AQHI sits at 6, you might shorten your route or shift to an indoor gym. Someone with asthma commuting in Fort Smith at AQHI 10 would limit time outside, close car windows, and run the air recirculation setting. Outdoor workers facing elevated readings can schedule physically demanding tasks for early morning when readings are often lower, take more frequent breaks indoors, and wear appropriate respiratory protection when necessary.
For vulnerable family members, young children, elderly relatives, anyone managing asthma, COPD, or heart disease, checking the forecast the night before helps you plan safer alternatives on high-risk days. Environment Canada’s educational materials explain symptoms to watch for and when to seek medical attention, giving you the knowledge to protect those who need it most.
Frequently Asked Questions About Air Quality
What does the AQHI scale from 1 to 10 mean?
The AQHI scale measures health risk from air pollution: 1-3 is low risk (air quality is good), 4-6 is moderate risk (consider reducing intense outdoor activity if you experience symptoms), 7-10 is high risk (reduce outdoor activity, especially for sensitive groups), and 10+ is very high risk (avoid outdoor exertion). The number reflects combined effects of ozone, particulate matter, and nitrogen dioxide at your location.
How is the smoke forecast calculated?
Smoke forecasts combine satellite data showing active fire locations, atmospheric models predicting wind direction and speed, and plume dispersion calculations to estimate where smoke will travel and how concentrated it will become. Environment and Climate Change Canada updates these forecasts as fires evolve and wind patterns shift.
Why does air quality vary so much between regions?
Wind patterns create dramatic regional differences by carrying pollutants from one area while clearing another. Today’s readings illustrate this: Fort Smith at 10 (high risk) likely reflects wildfire smoke transport on prevailing winds, while Maritime cities like Halifax at 2 (low risk) benefit from cleaner marine air flows, showing how a few hundred kilometers and different wind directions produce completely different air quality.
When should I avoid outdoor exercise?
At AQHI 7 or above, reduce or reschedule strenuous outdoor activities, especially if you have asthma, heart disease, or respiratory conditions. Children and older adults should also limit intense exercise at these levels. Even at moderate risk (4-6), pay attention to symptoms like coughing or shortness of breath and adjust activity accordingly.
These questions come up frequently because the AQHI system is designed for public use, but interpreting the numbers and knowing when to act requires some context. The scale itself is straightforward once you understand that each risk category corresponds to specific health recommendations. Low risk means you can carry on with normal activities. Moderate risk is a signal to watch for symptoms if you’re sensitive to air pollution. High and very high risk warrant real changes to your routine.
The wildfire smoke forecast process relies on sophisticated modeling, but the basic principle is simple: track where fires are burning, analyze current and predicted wind patterns, and project where smoke will travel. This forecast becomes especially important during fire season because smoke can appear hundreds of kilometers from the nearest fire, transported by high-altitude winds that you might not feel at ground level.
Regional variation puzzles many people who assume air quality should be relatively uniform across the country. Wind is the primary explanation. A city downwind from pollution sources or wildfire smoke will show elevated readings, while a location receiving clean ocean air or positioned away from pollutant transport routes stays clear. Pressure systems and topography also play roles, trapping pollutants in valleys or allowing breezes to flush them away.
The exercise question matters because physical activity increases breathing rate and depth, pulling more polluted air into your lungs. At higher AQHI levels, this exposure multiplies health risks. Shifting your workout indoors, choosing a less intense activity, or simply waiting until air quality improves protects your respiratory system without abandoning exercise altogether.
Understanding the Air Quality Health Index and the role wind patterns play in moving pollution across regions gives you the power to make informed decisions about your daily activities and protect your health. The AQHI translates complex atmospheric data into a simple number you can check each morning, while awareness of wind conditions helps explain why air quality can shift dramatically from one day to the next or why your city’s reading differs so much from a neighboring province. During wildfire season especially, when smoke can travel thousands of kilometers on prevailing winds, checking local air quality becomes as essential as checking the weather forecast.
Make air quality monitoring part of your routine by bookmarking Environment and Climate Change Canada’s Air Quality Health Index page and signing up for air quality alerts in your region. Share this information with elderly family members, children, and anyone with respiratory conditions who face higher risks during poor air quality days. When you plan outdoor exercise, yard work, or time with kids at the park, a quick AQHI check takes seconds and can prevent health problems.
Beyond individual actions, the bigger picture matters too. While we cannot control wildfires or wind patterns, we can reduce the baseline pollution that makes poor air quality events worse when natural factors align. Wind energy trade-offs and Canada’s energy transition toward renewable power sources directly lower emissions from electricity generation, meaning fewer pollutants in the air even before smoke or stagnant conditions arrive. Every reduction in everyday pollution creates cleaner starting conditions and healthier air for everyone.