
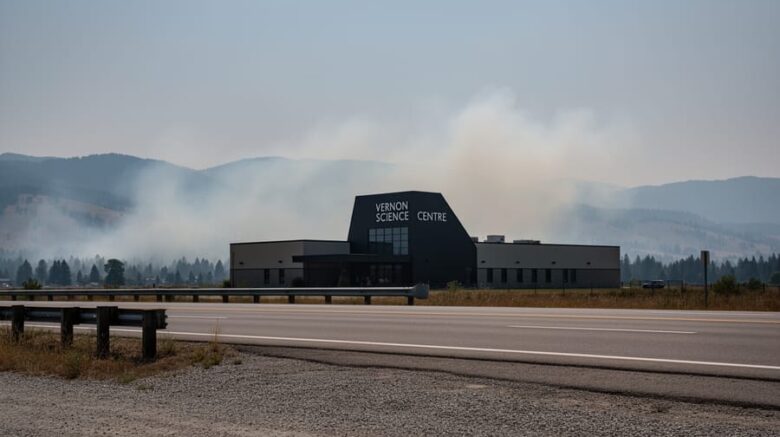
Vernon’s air quality currently sits at a moderate AQI of 88 at the Vernon Science Centre monitoring station, meaning most people can safely enjoy outdoor activities while sensitive groups should consider limiting prolonged exertion. The reading places conditions in the yellow “moderate” zone on Canada’s Air Quality Health Index, though reports indicate some areas are experiencing unhealthy conditions for sensitive populations, particularly those with respiratory conditions, young children, and older adults.
Understanding what drives these daily fluctuations matters for anyone living in or visiting the BC Interior. Vernon’s air quality shifts throughout the year based on wildfire smoke, seasonal inversions that trap pollutants in valley bottoms, and prevailing wind patterns that either clear the air or funnel contaminants from regional sources. Current wind speeds of 10 km/h at the monitoring station play a role in dispersing or concentrating airborne particles.
The relationship between AQHI and wind patterns is particularly important in Vernon’s geography. Surrounded by hills and situated in the Okanagan Valley, the city experiences unique airflow dynamics that directly affect pollution levels. Regional monitoring stations at Lavington Baptist Church, Kelowna College, Kamloops Federal Building, Kamloops Aberdeen, and Grand Forks City Hall provide a broader picture of air quality across the Interior, helping residents understand whether conditions are localized or part of a larger weather system.
Checking your local AQI before heading outdoors isn’t just cautious, it’s a practical step that protects your health and helps you plan your day around the cleanest air available.
Current Air Quality Readings in Vernon
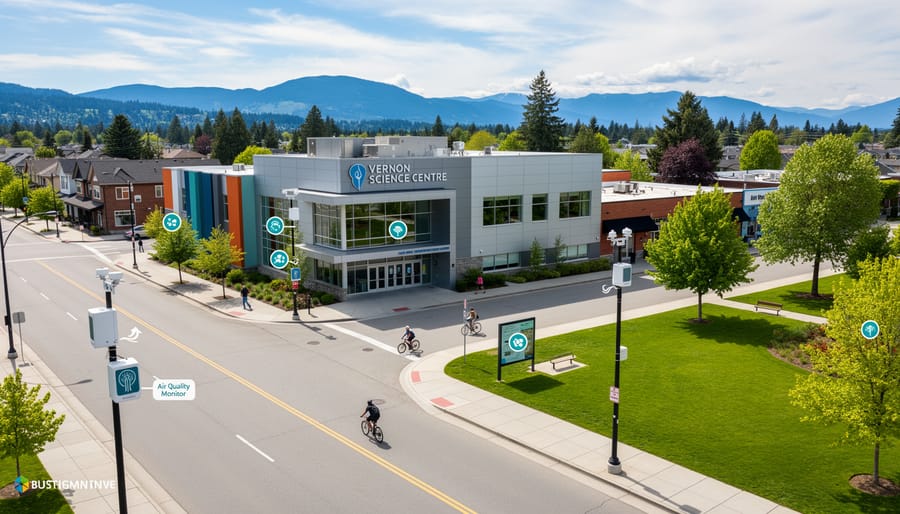
Right now, the Vernon Science Centre monitoring station reports an Air Quality Index of 88, which falls into the Moderate category. While this might sound reassuring, the broader picture reveals uneven conditions across the area, some residents are experiencing air quality that’s unhealthy for sensitive groups.
An AQI of 88 means most people can go about their day normally, but those with respiratory conditions, heart disease, or heightened sensitivity need to pay attention. Children and older adults should also watch for symptoms like throat irritation or shortness of breath during prolonged outdoor activity.
| AQI Range | Category | Who Should Be Concerned | Recommended Actions |
|---|---|---|---|
| 0-50 | Good | None | Enjoy outdoor activities |
| 51-100 | Moderate | Unusually sensitive individuals | Limit prolonged exertion if symptoms appear |
| 101-150 | Unhealthy for Sensitive Groups | Children, elderly, people with lung/heart conditions | Reduce prolonged outdoor exertion |
| 151-200 | Unhealthy | Everyone | Avoid prolonged outdoor exertion |
The variation between Vernon’s Moderate reading and pockets reporting unhealthy conditions for sensitive groups reflects how localized air quality can be. Factors like elevation, proximity to emissions sources, and micro-level wind patterns create these differences even within a few kilometers. If you’re planning a morning jog or letting kids play outside for hours, check your specific neighborhood’s reading rather than relying solely on the Vernon Science Centre data.
For practical purposes, today’s conditions mean that healthy adults can maintain regular routines without worry. However, if you have asthma, take medication for heart disease, or notice your child coughing during recess, scale back outdoor intensity or move activities indoors during peak pollution hours, typically mid-afternoon when sunlight and traffic combine to elevate pollutant levels.
Understanding Wind Patterns and Air Quality in the BC Interior
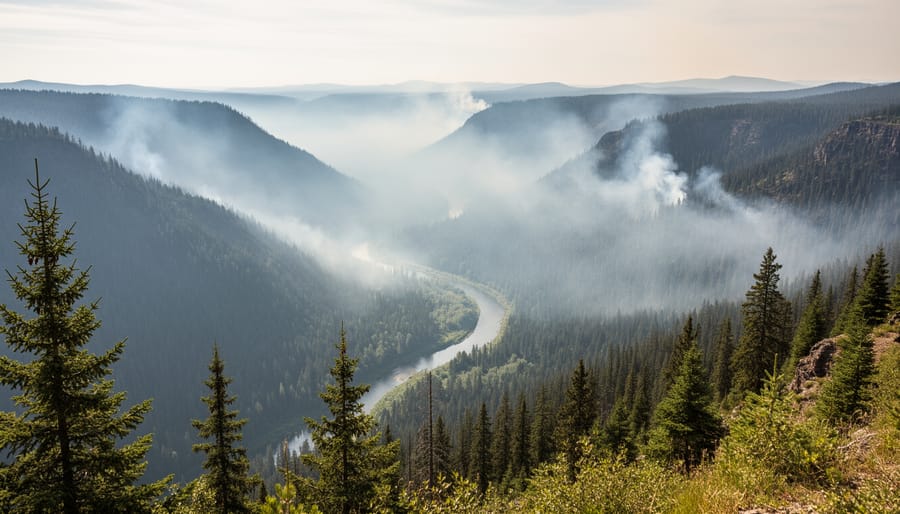
Wind speed and direction play crucial roles in determining whether pollutants accumulate or disperse across Vernon and the BC Interior. When wind measurements at Vernon Science Centre sit at 10 kilometres per hour, as they do currently, this moderate breeze helps move airborne particles away from populated areas, preventing stagnant air from trapping emissions near ground level.
Understanding how air quality works requires examining the unique topography of the Okanagan Valley and surrounding Interior regions. The valley’s orientation creates natural wind corridors that channel air flow in predictable patterns, typically running north-south along the valley floor. When winds blow from the south, they can carry pollutants from more populated areas like Kelowna northward toward Vernon. Conversely, northern winds often bring cleaner air from less developed regions.
The Interior’s mountain ranges add another layer of complexity. During temperature inversions, common in winter months, cold air becomes trapped beneath warmer air layers, creating a lid that prevents vertical air movement. Without upward dispersion, pollutants from vehicles, wood stoves, and other sources concentrate near ground level regardless of horizontal wind speed. The valley walls essentially form barriers that contain this trapped air until weather patterns shift.
Seasonal variations matter considerably. Summer typically brings more consistent afternoon winds generated by thermal differences between valley floors and mountain slopes. These winds help clear out daytime pollution buildup. Winter conditions, however, often feature calmer air and more frequent inversions, explaining why air quality tends to worsen during colder months even with similar emission levels. The interplay between wind patterns, valley geography, and seasonal weather creates the dynamic air quality conditions residents experience throughout the year.
Regional Monitoring Network and What It Tells Us
The BC Interior’s air quality monitoring network operates through strategically positioned stations that work together to paint a comprehensive picture of regional conditions. Vernon Science Centre serves as the primary monitoring hub for the North Okanagan, currently recording an AQI of 88 (Moderate). This central location captures air quality data for the Vernon core, but understanding the bigger picture requires looking at the surrounding network.
Lavington Baptist Church monitors conditions just east of Vernon, providing crucial data on how air quality shifts between the valley floor and elevated communities. This station often reveals different readings than Vernon proper, particularly when temperature inversions trap pollutants at specific elevations.
Further south, Kelowna College tracks Okanagan Valley conditions, helping identify whether air quality issues are localized to Vernon or part of a broader valley-wide pattern. The distance between these stations, roughly 50 kilometers, captures how pollutants travel through the natural corridor of the Okanagan.
The Kamloops stations (Federal Building and Aberdeen) extend the network west into the Thompson region. These two locations within the same city reveal how urban geography affects readings, with data often varying between downtown and residential areas. When Kamloops shows elevated readings while Vernon remains moderate, it signals westerly wind patterns pushing pollutants eastward.
Grand Forks City Hall rounds out the network to the south, monitoring the boundary region near the US border. This station catches air quality shifts from wildfires in Washington State and reveals whether southern winds are bringing clean or polluted air into the broader region.
Together, these six stations create a real-time map of air movement and quality across the BC Interior. By comparing readings between locations, residents can track pollution sources, predict how conditions might change, and understand whether their local air quality reflects isolated issues or regional patterns.
What Affects Air Quality in Vernon and Surrounding Areas
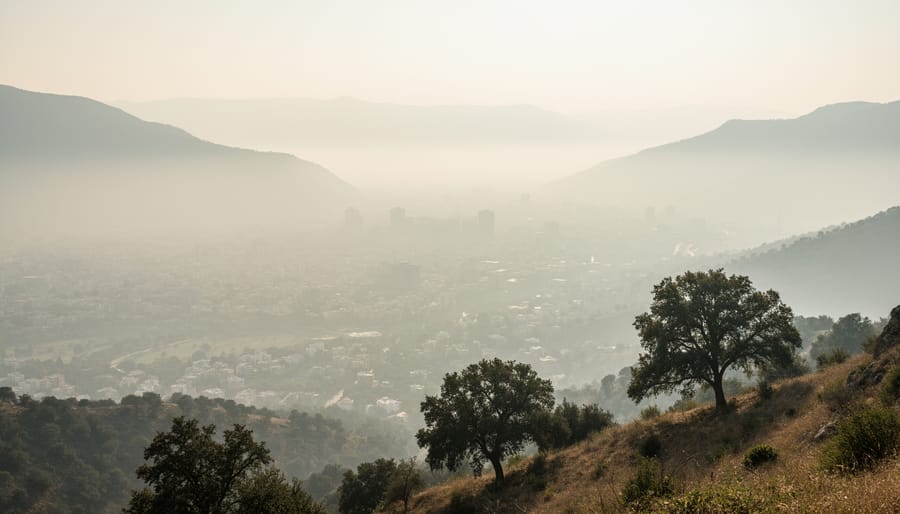
Air quality in Vernon fluctuates due to a mix of natural geography and human activity. The Okanagan Valley’s topography creates a natural bowl effect, trapping pollutants when atmospheric conditions are stable. During summer months, wildfire smoke from BC’s interior forests and neighboring regions becomes the dominant factor, as prevailing winds carry particulate matter across the valley. These seasonal events can spike AQI readings dramatically, sometimes shifting conditions from moderate to unhealthy within hours.
Vehicle emissions contribute year-round pollution, particularly along Highway 97 and within Vernon’s urban core. While individual cars produce less pollution than decades ago, the sheer volume of traffic, especially during tourist season, adds measurable nitrogen dioxide and fine particulates to the local airshed. Industrial operations, including sawmills and manufacturing facilities in the surrounding areas, release additional pollutants, though regulatory standards keep these sources relatively controlled compared to larger metropolitan regions.
Weather inversions present a unique challenge in the BC Interior. Cold air settles into valleys beneath warmer layers, creating a lid that prevents pollutants from dispersing vertically. These inversions occur most frequently during winter months when calm, clear nights allow temperatures to drop sharply. The result is a concentration of wood smoke from residential heating, vehicle exhaust, and industrial emissions near ground level, where residents breathe them in.
Natural wind corridors through the valley provide the primary mechanism for clearing polluted air. When wind speeds increase, fresh air from higher elevations sweeps through, diluting concentrated pollutants and improving conditions relatively quickly. The current moderate reading at Vernon Science Centre reflects this balance, enough air movement to prevent severe buildup, but not enough to ensure pristine conditions. Understanding these interacting factors helps residents anticipate air quality shifts and plan outdoor activities accordingly.
How to Check Air Quality and Stay Informed
Checking Vernon’s air quality takes just minutes and helps you protect your health during wildfire season, temperature inversions, and other environmental events. The BC government maintains real-time monitoring through its network of air quality stations, with data updating hourly throughout the day.
Visit the BC Air Quality website and select Vernon Science Centre as your monitoring station. You’ll see the current AQI number along with pollutant concentrations for PM2.5, PM10, ozone, and nitrogen dioxide. The site color-codes readings from green (good) through yellow, orange, and into red zones for unhealthy conditions.
Download the BC Air Quality app on your smartphone for instant notifications when conditions change. Set alerts for your specific sensitivity level, whether you’re healthy, have respiratory conditions, or care for children or elderly family members. The app sends push notifications when air quality shifts from moderate to unhealthy categories.
Air quality maps show how conditions vary across the region. Compare readings from Vernon Science Centre, Lavington Baptist Church, Kelowna College, and other nearby stations to see where air quality is better if you need to travel or relocate outdoor activities.
Check readings before morning workouts, planning afternoon events with kids, or scheduling outdoor work. An AQI of 50 means unrestricted activities, while 101 or higher suggests limiting prolonged exertion outdoors. Sensitive groups should reduce outdoor time when the AQI reaches 51.
Bookmark the Vernon Science Centre monitoring page and make checking it part of your daily routine during summer months and winter inversion periods.
Common Questions About Vernon’s Air Quality
What AQI level is considered unsafe for outdoor activities?
AQI levels above 100 are unhealthy for sensitive groups, including children, elderly people, and those with respiratory conditions. When readings exceed 150, everyone should limit prolonged outdoor exertion.
Why does Vernon’s air quality fluctuate throughout the day?
Air quality changes based on wind patterns, temperature inversions, and time of day. Morning inversions can trap pollutants near the ground, while afternoon winds often improve dispersion and air quality.
How can I protect myself during poor air quality days?
Stay indoors when AQI exceeds 100, close windows, use air purifiers if available, and avoid intense outdoor exercise. Check the Environment Canada AQHI before planning outdoor activities.
Does Vernon experience seasonal air quality patterns?
Summer wildfire season typically brings the worst air quality, while winter inversions can trap vehicle emissions and wood smoke. Spring and fall generally offer cleaner air with better ventilation from regional wind patterns.
Understanding these common concerns helps residents make informed decisions about daily activities and health precautions. The Vernon Science Centre monitoring station provides reliable data that reflects conditions across the central city, while nearby stations at Lavington Baptist Church and Kelowna College offer additional regional context. Different groups face varying levels of risk at the same AQI reading, what registers as moderate for healthy adults may already affect someone with asthma or heart conditions.
Timing matters when checking air quality. A morning reading of 88 might climb by afternoon if winds calm or drop if breezes pick up. Monitoring trends throughout the day gives you a clearer picture than relying on a single snapshot, especially during wildfire season when smoke patterns shift rapidly with changing wind directions.
Staying informed about Vernon’s air quality isn’t just about checking numbers, it’s about understanding how the BC Interior’s unique geography and weather patterns shape the air we breathe. Wind conditions, seasonal changes, and regional monitoring data work together to give us a complete picture of air quality across the area.
Make checking air quality readings part of your routine, especially during wildfire season or when weather conditions trap pollutants. The monitoring network across Vernon, Kelowna, Kamloops, and surrounding communities provides the data you need to protect your health and plan your activities wisely.
You can make a difference too. Small actions add up: reducing vehicle idling, supporting clean energy initiatives, and sharing air quality information with neighbors all contribute to healthier air in our region. Consider participating in local environmental programs or advocating for stronger air quality protections in the BC Interior.
The air we share connects us all. By staying aware of current conditions and taking steps toward sustainable practices, you’re helping ensure cleaner air for everyone in the Vernon area. Check today’s readings, understand what they mean, and use that knowledge to make informed choices for yourself and your community.