
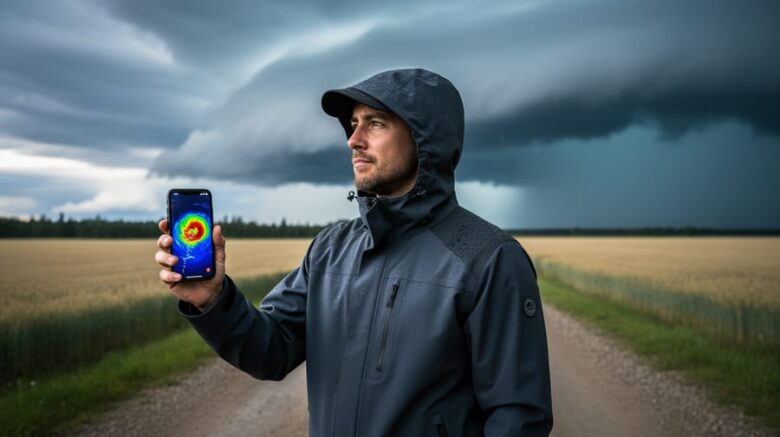
Tracking storms near Chipman is straightforward: access real-time weather radar through Environment and Climate Change Canada’s network or Weather Underground’s Chipman station page, then watch for precipitation patterns, movement direction, and intensity changes to make informed decisions about outdoor activities or travel. This process takes just minutes and requires no special equipment beyond internet access, but understanding how to read radar imagery properly makes the difference between spotting a brief shower and recognizing a severe weather system.
Chipman’s weather radar installation, completed in 2019 as part of Canada’s nationwide radar network modernization, serves as one of 33 new stations providing enhanced coverage across the country. The station updates continuously, with some platforms refreshing data in real time, giving you access to the same information meteorologists use to track precipitation type, storm intensity, and movement patterns. While radar technology has revolutionized weather monitoring, it works best when you understand its limitations and combine radar data with other forecasting tools.
Real-time radar imagery helps you answer urgent questions: Is that storm cell moving toward my location? How intense is the precipitation? Will conditions improve in the next hour? Whether you’re planning agricultural work, scheduling outdoor events, or simply deciding if you need an umbrella, learning to interpret radar returns transforms raw data into practical weather intelligence that protects both safety and schedules.
What You’ll Need to Access Chipman Weather Radar
You’ll need just a few everyday items to start tracking storms on Chipman’s weather radar. No subscriptions, downloads, or specialized equipment are required, everything runs through your web browser, making real-time radar data free and accessible to anyone.
- Internet-enabled device: computer, tablet, or smartphone with a current web browser
- JavaScript enabled in your browser for interactive map features and automatic updates
- Reliable internet connection to load radar imagery and animation loops
For the best experience, bookmark one or more of these recommended radar sources. Weather Underground’s Chipman Radar Canada Station page provides an interactive map with color-coded precipitation data and automatic refresh. AccuWeather’s Chipman radar shows recent precipitation movement to help you anticipate storm timing. Environment Canada’s official weather service offers radar alongside active alerts and forecasts, and their WeatherCAN mobile app (free) puts radar data on your phone for checking conditions on the go.
All three platforms work on any device with a modern browser. If your browser has JavaScript disabled, you’ll still see radar images, though you may need to manually refresh the page to get the latest data. The Weather Underground page updates continuously, displaying “update in: 0 sec” when fresh radar scans arrive, so you’re always viewing current conditions without refreshing.
Understanding Chipman’s Weather Radar Coverage
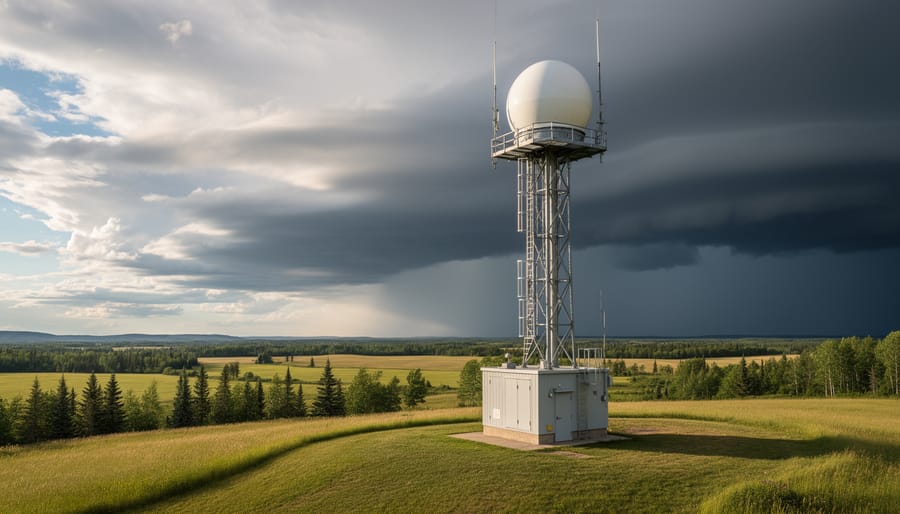
The Chipman Radar Canada Station serves as a critical node in Environment and Climate Change Canada’s 33-station national weather monitoring network. Located in New Brunswick, this installation provides continuous surveillance of weather patterns across the region, filling what was previously a significant gap in radar coverage for eastern Canada. The Chipman radar completed in 2019 as part of a nationwide modernization initiative that began in October 2017, bringing advanced dual-polarization technology to the area.
The radar’s coverage extends approximately 240 kilometers in radius, capturing weather systems as they approach from multiple directions. This range allows residents throughout central New Brunswick and surrounding areas to monitor incoming storms well before they arrive. The system detects precipitation type and movement distinguishing between rain, snow, freezing rain, and mixed precipitation while measuring intensity levels. You’ll see not just where precipitation is falling now, but how those patterns have shifted over recent hours.
The 2017-2019 modernization project replaced older radar units with dual-polarization technology, which provides far more detailed information about storm structure and precipitation characteristics. This upgrade allows meteorologists and the public to see storm development with greater precision, including better differentiation between rain and hail, improved detection of freezing precipitation, and more accurate rainfall estimates. For residents tracking an approaching system, this means clearer, more reliable data to inform decisions about outdoor activities, travel routes, and storm preparation timing.
Step-by-Step: How to Read Real-Time Radar Data
Reading the Color Scale and Intensity Markers
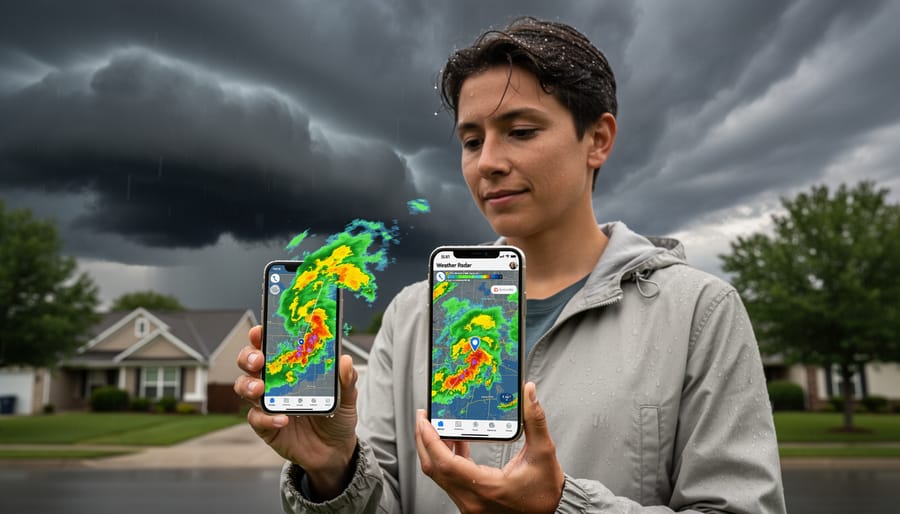
The radar’s color scale translates raw data into an intuitive visual system. Green shades indicate light precipitation, typically drizzle or light rain that won’t disrupt most outdoor activities. Yellow and orange mark moderate rainfall; you’ll want an umbrella, but conditions remain manageable for driving and short errands. Red zones signal heavy precipitation, often associated with thunderstorms or intense rain bands that can reduce visibility and create hazardous road conditions.
Watch for color patterns, not just individual pixels. A narrow band of red surrounded by yellow suggests a fast-moving squall line. Widespread orange across the radar indicates steady, prolonged rainfall that may lead to localized flooding. Bright red cores embedded within larger storm systems often mark the most intense cells, where hail or damaging winds become more likely.
Purple or magenta tones, when present, typically indicate extremely heavy rainfall rates or mixed precipitation types like freezing rain. These colors demand immediate attention and warrant checking Environment Canada’s active alerts. The radar refreshes continuously (showing “update in: 0 sec” on Weather Underground), so colors that persist or intensify over multiple frames reveal strengthening storms, while fading colors indicate weakening systems moving away from your location.
Tracking Storm Movement and Timing
Radar animation transforms static images into a motion picture of approaching weather. Most radar interfaces include a play button or timeline slider that loops through the past few hours of data, revealing the path and speed of storm systems. Watch how precipitation bands move across the map, storms tracking from west to east typically arrive faster than those drifting from the north. Count the number of frames between when a storm appears at the edge of coverage and when it reaches a landmark you recognize, then estimate how many minutes until it arrives at your location.
Pay attention to color changes in successive frames. If green patches turn yellow or orange as they approach, the system is intensifying and you should take preparations more seriously. Conversely, weakening storms fade from bright colors to lighter shades, suggesting conditions will improve. Note the shape of the precipitation field, tightly organized clusters often indicate stronger, faster-moving cells, while scattered or fragmented patterns suggest disorganized weather that may dissipate or change direction. The animation also reveals whether multiple waves are following the same track, helping you decide if conditions will persist for hours or clear quickly after the initial front passes.
Important Limitations and Safety Considerations
While radar is a valuable planning tool, it has important limitations you need to understand before relying on it during severe weather. The Chipman station shows precipitation patterns effectively, but simulated radar displayed over certain regions, particularly oceans and some international areas, may not update as frequently as the local radar feed. More critically, radar only detects precipitation; it cannot show tornadoes, lightning strikes, wind speeds, or other dangerous conditions that often accompany storms.
Radar is best used as a planning tool for everyday decisions, timing your commute, rescheduling outdoor work, or preparing your property ahead of approaching rain. When summer extreme weather develops or extreme temperature warnings are issued, always cross-reference what you see on radar with official forecasts and warning systems. The radar shows you where precipitation is, but meteorologists combine that data with atmospheric conditions, satellite imagery, and ground observations to issue the warnings that can save lives.
Verifying Storm Predictions and Taking Action
Radar data shows you what’s happening now, but you’ll need to confirm it with official forecasts before making major decisions. Visit Environment Canada’s weather alerts page to check for active warnings or watches in your area. Cross-reference what you see on the Chipman radar with local forecast discussions, which explain why meteorologists expect certain conditions. As storms approach, refresh the radar every 15 to 20 minutes to track changes in intensity or direction.
Once you’ve verified the threat, take practical steps based on what radar reveals. If heavy precipitation is moving toward you within the hour, bring lawn furniture and outdoor equipment indoors, close windows, and move vehicles under cover if possible. For longer-duration storms, plan alternative routes for essential travel or reschedule outdoor activities. Check the Air Quality Health Index alongside radar data, since storms can affect air quality conditions before and after precipitation events. Keep monitoring radar and alerts until the system passes, and remember that conditions can shift quickly, what looks like a minor rain shower may intensify or change direction.
Common Questions About Chipman Weather Radar
How often does the Chipman radar update?
The Chipman radar updates continuously in real-time. Weather Underground’s radar page displays “update in: 0 sec,” indicating live data refresh as new scans complete, typically every few minutes during active weather.
What’s the difference between radar and satellite imagery?
Radar actively sends out signals and measures what bounces back from precipitation, showing real-time rain and snow location and intensity. Satellite imagery captures cloud-top images from space but can’t see through clouds to detect precipitation at ground level the way radar does.
Can I see future storm predictions on radar?
No, radar shows only current and recent precipitation, not forecasts. You can track a storm’s direction and speed using animation features to estimate when it might reach your area, but radar itself doesn’t predict future development or generate forecasts.
Why does radar sometimes show precipitation when it’s not raining at my location?
Radar detects precipitation high in the atmosphere, which may evaporate before reaching the ground in dry conditions. Radar beams also scan above ground level, so what appears overhead on radar might fall elsewhere due to wind drift or miss your exact location entirely.
These questions reflect what most Chipman-area residents wonder when first using weather radar tools. Understanding these limitations helps you interpret radar data more accurately and combine it with ground observations. As communities invest more in environmental monitoring infrastructure, from weather stations to wind energy benefits assessment, accessible radar technology becomes part of a broader toolkit for climate-aware decision-making. The Chipman radar station, installed in 2019 as part of Canada’s 33-station network upgrade, represents this commitment to giving residents reliable, real-time weather information for daily planning and storm preparation.
Real-time weather radar access puts storm tracking directly in your hands, transforming how you prepare for severe weather near Chipman. By checking radar before heading out, securing outdoor items ahead of approaching systems, or simply planning your day around precipitation patterns, you’re making informed decisions that protect your property and safety. The 2019 completion of Chipman’s radar installation represents Canada’s broader commitment to modernizing environmental monitoring infrastructure, an investment that benefits communities nationwide while providing crucial data for climate research.
Bookmark your preferred radar source today and check it routinely during storm season. Share what you’ve learned with neighbors who might benefit from real-time weather monitoring, especially those managing outdoor work or vulnerable to power outages. Understanding weather patterns connects directly to broader environmental awareness: as climate shifts intensify storm activity, technologies like weather radar become even more valuable. Explore how climate change impacts shape local weather, discover renewable energy benefits for building resilient communities, or learn practical energy conservation practices that reduce your environmental footprint while preparing for weather disruptions.