
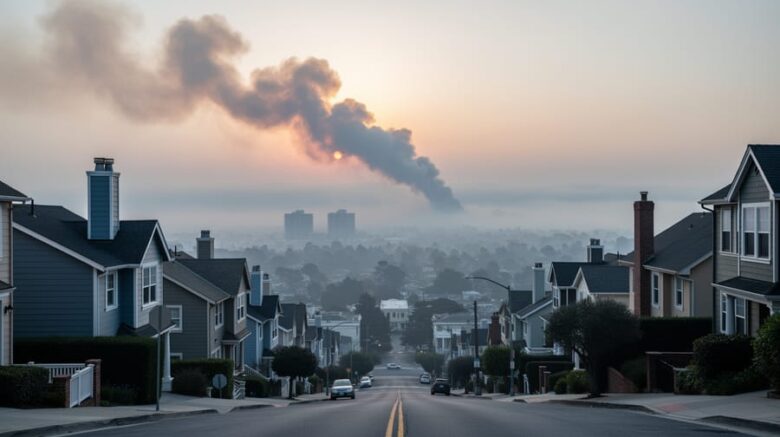
Weather air quality refers to how atmospheric conditions like wind speed, temperature, and precipitation affect the concentration and movement of pollutants in the air we breathe. When you check your local air quality forecast, you’re seeing the combined influence of both human-made emissions and the weather systems that disperse, trap, or transport those pollutants across regions.
This relationship matters because poor air quality affects more than just visibility. Elevated concentrations of fine particulate matter (PM2.5) and ground-level ozone can trigger asthma attacks, aggravate heart conditions, and force the cancellation of outdoor activities. For environmentally conscious individuals, understanding weather air quality means making smarter decisions about when to exercise outdoors, when to keep windows closed, and how regional wind patterns can bring wildfire smoke from hundreds of miles away.
The connection between weather and air pollution has grown more critical as climate patterns shift and wildfire seasons extend. Environment and Climate Change Canada now generates air quality model forecast maps twice daily, showing the dispersion of wildfire smoke and hourly concentrations of PM2.5, ground-level ozone, and nitrogen dioxide for the next 72 hours. These forecasts demonstrate how wind direction and speed can transform a clear morning into a hazy afternoon.
This article explains the mechanisms behind weather-driven air quality changes, the types of forecasting systems available to track pollution movement, and practical ways you can use this information to protect your health and plan your day. You’ll learn how to read forecast maps, interpret air quality indices, and recognize the weather patterns that signal incoming pollution events in your region.
What Weather Air Quality Means
Weather air quality describes how the atmosphere’s physical conditions, temperature, humidity, wind speed and direction, and atmospheric pressure, determine where pollutants go and how concentrated they become. These meteorological factors act like invisible hands, either dispersing contaminants across wide areas or trapping them close to the ground where people breathe them in.
Think of it this way: pollutants don’t simply hang in the air unchanged. Wind can sweep them away from their source or funnel them into valleys. Temperature layers can create invisible ceilings that prevent pollutants from rising and dispersing. Humidity influences how particles clump together, while atmospheric pressure systems steer weather patterns that carry pollution hundreds of miles from where it originated.
Understanding a few key terms helps you make sense of air quality information:
- PM2.5
- Particulate matter smaller than 2.5 micrometers, about 30 times finer than a human hair. These microscopic particles can penetrate deep into your lungs and bloodstream, making them particularly harmful to health.
- Ground-level ozone
- A reactive gas formed when sunlight triggers chemical reactions between nitrogen oxides and volatile organic compounds. Unlike the protective ozone layer high in the atmosphere, ground-level ozone irritates airways and worsens respiratory conditions.
- Nitrogen dioxide
- A reddish-brown gas produced mainly by vehicle engines and power plants. It contributes to smog formation and can inflame airways, especially in children and people with asthma.
- Air Quality Health Index (AQHI)
- A numbered scale that translates complex pollution measurements into simple health risk categories, helping you decide whether it’s safe to exercise outdoors or if vulnerable groups should stay inside.
The relationship works both ways. Weather doesn’t just move existing pollution around, it also influences how much pollution forms in the first place. Hot, stagnant summer days create ideal conditions for ozone formation, while cold winter inversions trap vehicle emissions near busy roads. Recognizing these patterns lets you anticipate when air quality might deteriorate and plan accordingly, whether you’re scheduling outdoor activities or managing health conditions affected by poor air.
How Wind Patterns and Weather Affect Air Quality
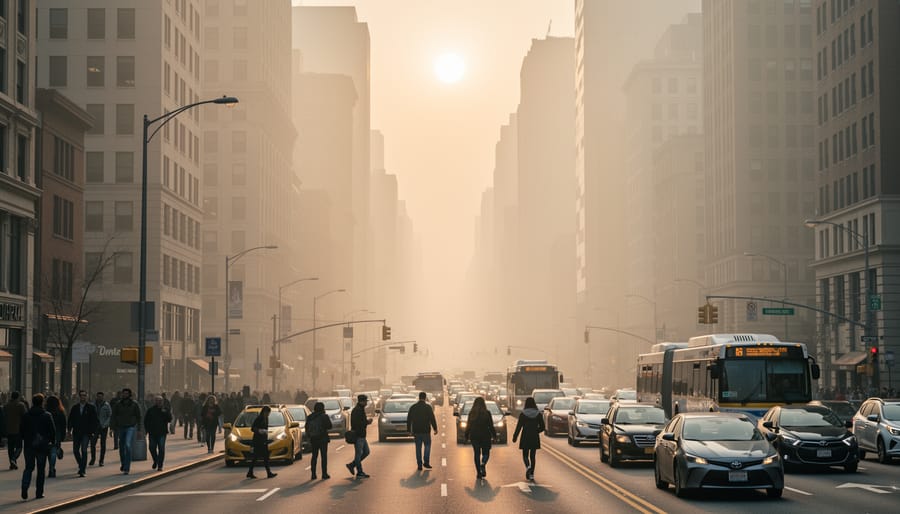
Weather conditions act as the invisible hand controlling how pollutants move, concentrate, and eventually disperse through the atmosphere. Understanding these mechanisms helps explain why air quality varies dramatically from one day to the next, even when emission sources remain constant.
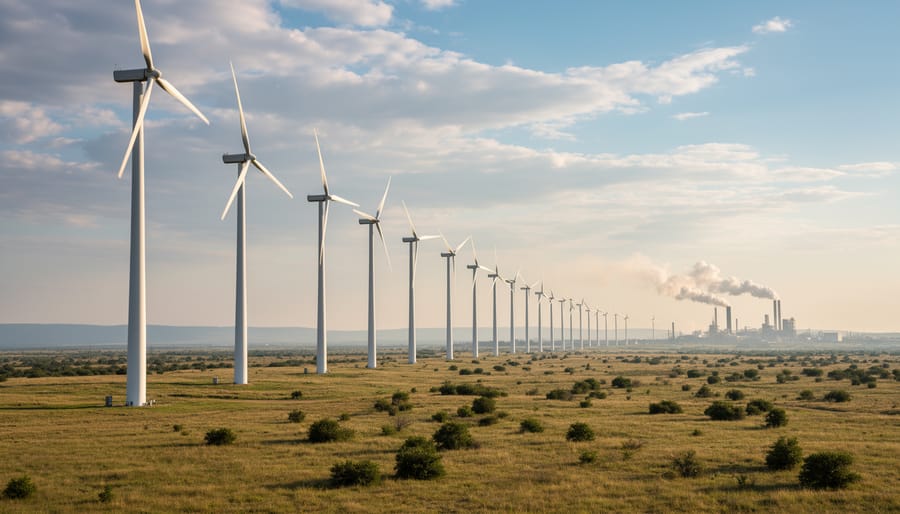
Wind speed and direction serve as the primary dispersal system for airborne pollutants. Strong, consistent winds sweep contaminants away from their sources and distribute them across wider areas, reducing local concentrations. Light winds or calm conditions allow pollutants to accumulate near emission sources, creating pockets of poor air quality. Wind direction determines which communities receive pollutants and which remain upwind of major sources. This is why wind energy facts often highlight placement in regions with robust wind patterns, these same conditions that make sites viable for power generation also facilitate natural air cleansing.
Temperature inversions create some of the worst air quality episodes by reversing the normal atmospheric structure. Under typical conditions, air temperature decreases with altitude, allowing warm pollutants to rise and disperse. During an inversion, a layer of warm air sits above cooler surface air, forming a lid that inversion traps pollution near ground level. Pollutants accumulate in the shallow layer beneath this ceiling, unable to escape vertically. Cities in valleys experience this phenomenon frequently during winter months and overnight periods.
Humidity influences air quality through complex chemical and physical processes. High moisture levels promote the formation of secondary pollutants, water vapor combines with nitrogen oxides and sulfur dioxide to create fine particles and ground-level ozone. Humid air also allows existing particles to absorb moisture and grow larger, which can worsen respiratory impacts. Conversely, very dry conditions prevent some particle formation but allow dust and other dry pollutants to remain airborne longer.
Precipitation provides the atmosphere’s most effective cleansing mechanism. Rain and snow physically capture airborne particles and pull them to the ground, a process called wet deposition. A moderate rainstorm can dramatically improve air quality within hours by washing pollutants from the air. This explains why air often smells and feels cleaner after rain.
Several weather factors work together to determine air quality conditions:
- Wind speed and direction control pollutant dispersal and transport
- Temperature inversions trap contaminants near the surface
- Humidity levels affect particle formation and growth
- Precipitation removes pollutants through wet deposition
- Atmospheric pressure influences vertical mixing and pollutant concentration
These interacting factors create the complex relationship between meteorological conditions and the air we breathe. Forecasters monitor all these variables to predict air quality changes, while renewable energy planners use the same data to optimize facility placement and operation.
Types of Air Quality Forecasts and Monitoring Systems
Wildfire Smoke Forecasts
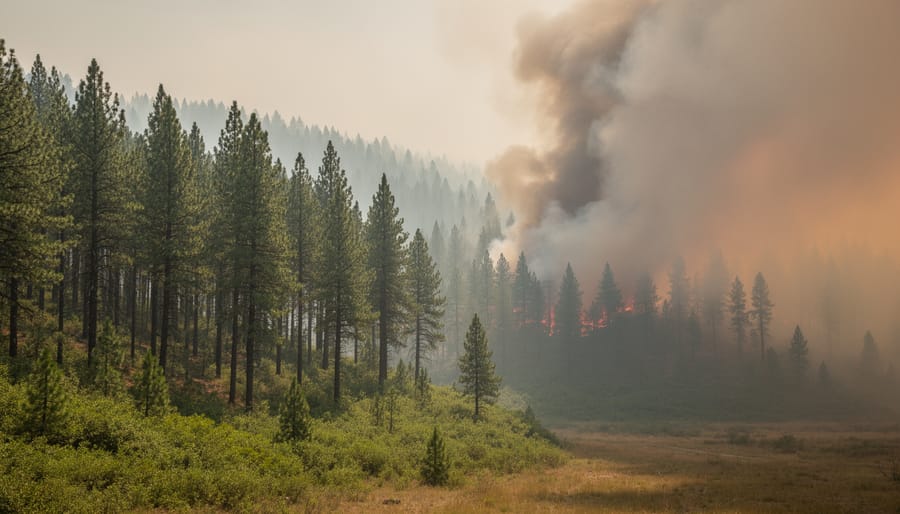
Wildfire smoke forecasts represent a critical advancement in protecting public health during active fire seasons. Systems like BlueSky Canada use satellite detections to pinpoint active fires and model where smoke will travel over the next 48-72 hours. When a satellite identifies a heat signature indicating a wildfire, the forecast system calculates how wind patterns, atmospheric stability, and temperature gradients will move that smoke across regions. Environment and Climate Change Canada generates these air quality model forecast maps twice daily, showing hourly concentrations of PM2.5 and other pollutants as smoke disperses across North America for the next 72 hours.
These forecasts remain experimental because they face significant limitations. BlueSky Canada cannot model smoke originating outside its forecast boundaries, if a major fire burns just across the border or beyond the modeled domain, that smoke enters the region as an unaccounted-for surprise. The framework currently lacks a mechanism to transport externally-sourced smoke into the forecast area, meaning air quality maps may underestimate total smoke exposure when fires rage outside the coverage zone. Wind patterns play a crucial role here: strong upper-level winds can carry smoke hundreds of miles from distant fires, yet if those fires fall outside the satellite detection boundary, forecasters can’t predict their impact. Despite these constraints, wildfire smoke forecasts provide essential lead time for vulnerable populations to prepare, adjust outdoor activities, and take protective measures before smoke arrives.
Pollutant Concentration Models
Government meteorological agencies use sophisticated computer models to predict how pollutants will move through the atmosphere over coming days. Environment and Climate Change Canada, for instance, generates air quality model forecast maps twice daily producing detailed predictions that show hourly concentrations of PM2.5, ground-level ozone, and nitrogen dioxide for the next 72 hours across North America.
These models work by combining real-time air quality measurements from ground monitoring stations with weather forecast data, including predicted wind speeds, wind directions, temperature profiles, and atmospheric mixing heights. The computer simulations then calculate how existing pollutants will disperse, where new emissions will travel, and how chemical reactions in the atmosphere will transform certain compounds. A factory’s nitrogen dioxide emissions, for example, might be shown moving northeast with prevailing winds, diluting as it spreads, while ozone concentrations build in urban areas during sunny afternoons when sunlight triggers chemical reactions between pollutants.
The visual forecast maps display pollutant concentrations using colour gradients, making it easy to see regional patterns at a glance. You can track how a plume of smoke from wildfires drifts across provinces or how vehicle emissions concentrate in city centers during rush hour, then watch those concentrations shift as weather conditions change throughout the forecast period.
Air Quality Health Index Systems
The Air Quality Health Index and similar systems convert real-time pollutant measurements into a simple numerical scale that indicates health risk levels. These indices typically use a scale from low risk to high risk, with corresponding recommendations for outdoor activities and vulnerable populations. The system aggregates data from multiple pollutants including ground-level ozone, PM2.5, and nitrogen dioxide to create a single number that reflects overall air quality conditions. Unlike raw pollutant concentrations measured in micrograms per cubic meter, health indices translate scientific data into practical guidance anyone can understand and act on immediately. Most indices update hourly and include forecasts, allowing people to plan outdoor activities around anticipated air quality changes driven by shifting weather patterns.
Real-World Applications and Uses
Weather air quality data powers critical decisions across public health, energy, agriculture and environmental management. Understanding these applications helps you recognize why accurate forecasting matters for everyday life and long-term sustainability.
Public health authorities rely on air quality forecasts to issue timely advisories that protect vulnerable populations. When deteriorating conditions are predicted, officials can warn people with asthma, heart disease, or respiratory conditions to limit outdoor exposure. The Environment Canada AQHI translates complex pollutant data into risk categories that guide these protective measures, from recommending reduced outdoor exercise to advising school districts to cancel recess during high-pollution episodes.
- Health protection through early warnings for sensitive groups during poor air quality events
- Outdoor activity planning based on real-time and forecasted pollutant concentrations
- Renewable energy optimization by matching production schedules to air quality patterns
- Agricultural decisions including timing of field operations and livestock management
- Emissions management strategies that respond to weather conditions affecting dispersion
Wind and solar facilities monitor local air quality to assess their environmental footprint and optimize operations. Wind farm operators track how prevailing wind patterns disperse emissions from nearby industrial sources, demonstrating the clean energy facility’s role in improving regional air quality. Solar installations use air quality data to predict panel efficiency, since particulate matter reduces sunlight transmission and energy generation. Some facilities adjust maintenance schedules based on forecasted dust events or wildfire smoke that could coat panels and reduce output.
Agricultural operations integrate air quality forecasts into daily planning. Farmers delay tilling or harvesting when stagnant air conditions would trap dust and particulates near the ground, protecting workers and neighboring communities. Livestock managers use temperature and air quality predictions together, since heat combined with high ground-level ozone creates dangerous conditions for animals in outdoor feedlots.
Environmental regulators use weather-air quality relationships to craft evidence-based policies. Emission permit conditions often include restrictions during atmospheric inversions or other weather patterns that concentrate pollutants. Industrial facilities monitor meteorological conditions to time maintenance activities and startup procedures when favorable winds will rapidly disperse temporary emission spikes, minimizing community exposure while maintaining operational flexibility.
Common Questions About Weather and Air Quality
How does weather affect air quality?
Weather conditions directly control how pollutants disperse, concentrate, or get trapped in the atmosphere. Wind speed carries pollutants away from their sources, while temperature inversions can trap them close to the ground, and rain naturally cleanses the air by removing particles.
How do wind and weather conditions affect air quality?
Strong winds disperse pollutants across wider areas and reduce local concentrations, while calm conditions allow them to build up. Temperature, humidity, and atmospheric pressure also influence how particles form and move, creating regional patterns that forecasters track when predicting air quality.
What is the AQHI and how is it calculated?
The Air Quality Health Index translates measured concentrations of major pollutants into a simple 1-10 scale that indicates health risk levels. It combines readings of ground-level ozone, PM2.5, and nitrogen dioxide into a single number that helps people decide whether it’s safe for outdoor activities.
How far ahead do smoke forecast maps go?
Most wildfire smoke forecasts, including the experimental BlueSky Canada system, provide predictions for the next 48-72 hours. Environment and Climate Change Canada generates air quality model forecast maps twice daily, showing expected smoke movement and pollutant concentrations across North America for three days ahead.
Understanding when to check these forecasts makes a practical difference. If you have respiratory conditions or plan outdoor exercise, review the forecast each morning before heading out. Air quality can shift throughout the day as wind patterns change and temperatures rise or fall, so conditions at dawn often differ from afternoon levels.
Most forecasting systems update twice daily, giving you fresh data to work with. During wildfire season or high-pollution events, checking updates more frequently helps you adjust plans as conditions evolve. The 72-hour forecast window lets you plan multi-day outdoor activities with reasonable confidence, though accuracy naturally decreases the further out you look.
Keep in mind that experimental systems like BlueSky Canada have limitations. They can’t model smoke drifting in from sources outside their forecast boundaries, which means surprises are possible if fires ignite just beyond the coverage area. Despite these constraints, current forecasts remain valuable tools for protecting your health and making informed decisions about when and where to spend time outdoors.
Understanding how weather shapes air quality empowers you to protect your health and contribute to a cleaner environment. Wind patterns, temperature inversions, humidity levels, and precipitation all determine whether pollutants disperse quickly or linger in your local air. By checking regional air quality forecasts regularly, you can plan outdoor activities when conditions are safest and reduce exposure during high-pollution periods.
Your daily choices matter too. Supporting renewable energy projects reduces the emissions that weather systems transport across regions. Simple conservation efforts, reducing energy use, choosing sustainable transportation, advocating for cleaner air policies, create measurable improvements over time. When you combine personal awareness of weather-driven air quality patterns with collective action on emissions reduction, you help build healthier communities and a more sustainable future for everyone.