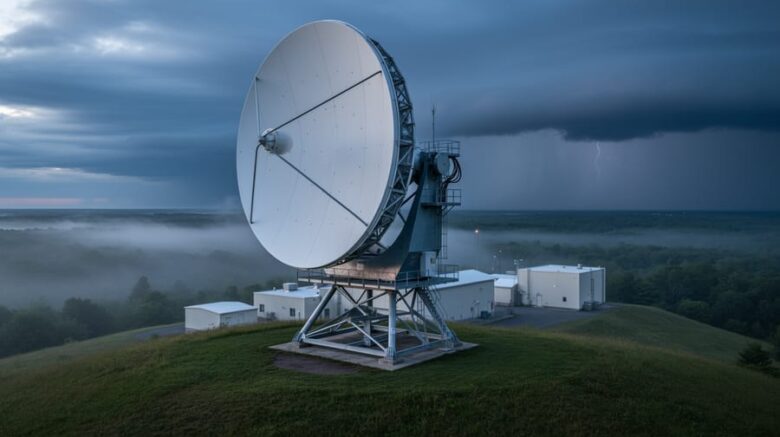
A weather radar is a specialized instrument that detects precipitation and atmospheric conditions by transmitting electromagnetic pulses and analyzing their reflected signals. When you’re checking Montreal’s weather radar, you’re viewing real-time data from Environment and Climate Change Canada’s network of sophisticated S-band systems that track rain, snow, and storm movements across the region.
For Montreal residents and visitors, radar imagery does more than show where it’s currently raining. These systems reveal wind patterns, storm intensity, and precipitation velocity, making them essential tools for planning outdoor activities, protecting property, and staying safe during severe weather events. The radar network across Canada’s most populated regions detects threats like thunderstorms, flooding conditions, and tornadoes before they arrive, giving communities crucial warning time.
What many environmentally conscious readers may not realize is how weather radar technology intersects with renewable energy infrastructure. As Canada expands its wind energy capacity, radar operators must account for wind turbines in their coverage maps. ECCC manages 32 operational weather radars, and their placement considers where turbines might affect signal quality or appear as false precipitation returns.
Understanding how these radar systems work helps you interpret what you’re seeing on Montreal weather maps and appreciate the environmental considerations behind the technology. From 2018 to 2023, Canada upgraded its radar network with new S-band systems that extended reflectivity detection to 300 kilometers and full Doppler coverage to 240 kilometers. These improvements mean better storm tracking and more accurate wind pattern analysis, serving both public safety and smart environmental planning as our energy landscape evolves toward sustainability.
What Weather Radar Means for Montreal and Surrounding Regions
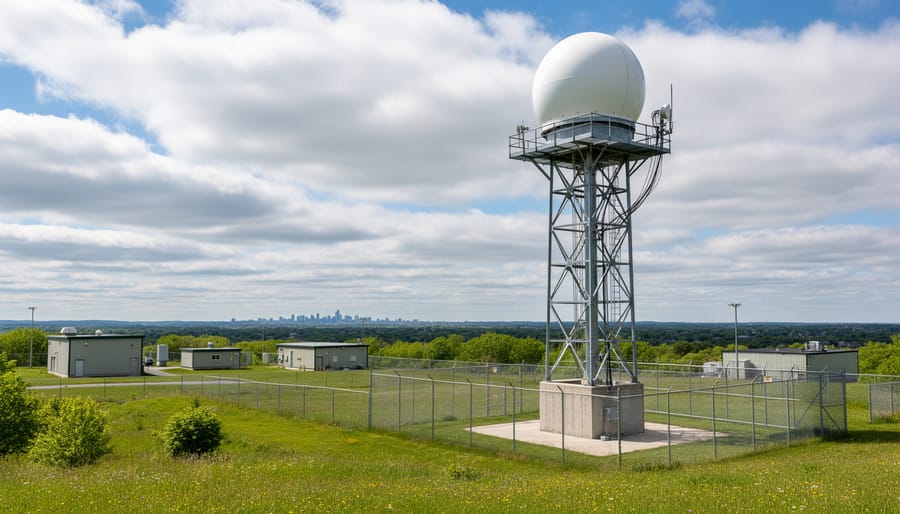
Weather radar is a specialized technology that sends out pulses of electromagnetic energy to detect precipitation in the atmosphere and measure how it moves. When these pulses encounter raindrops, snowflakes, or hail, they bounce back to the radar station, creating a picture of where precipitation is falling and how intense it is. For Montreal and surrounding regions, this technology operates continuously, scanning the skies in a 360-degree sweep to provide real-time information about approaching storms, rainfall rates, and severe weather threats.
Montreal’s weather radar station is one of 33 installations operated by Environment and Climate Change Canada, forming a 33-radar network covers most-populated regions across the country. This network wasn’t designed to provide complete coverage of Canada’s vast geography. Instead, it focuses on areas where most Canadians live and work, prioritizing early detection of precipitation, its motion, and the threat it poses to life and property. The Montreal station plays a vital role in this network, monitoring weather patterns across southern Quebec and portions of eastern Ontario.
The radar’s primary job is detection and tracking rather than prediction alone. While meteorologists use sophisticated computer models to forecast what weather might develop hours or days ahead, radar shows what’s actually happening right now. It reveals where rain is falling at this moment, how quickly a storm system is moving, and whether rotation patterns suggest tornado development. For communities around Montreal, this means earlier warnings when severe thunderstorms develop, better snow accumulation estimates during winter weather, and more accurate information about when precipitation will arrive or end.
How Montreal’s Weather Radar System Works
Detecting Precipitation and Movement
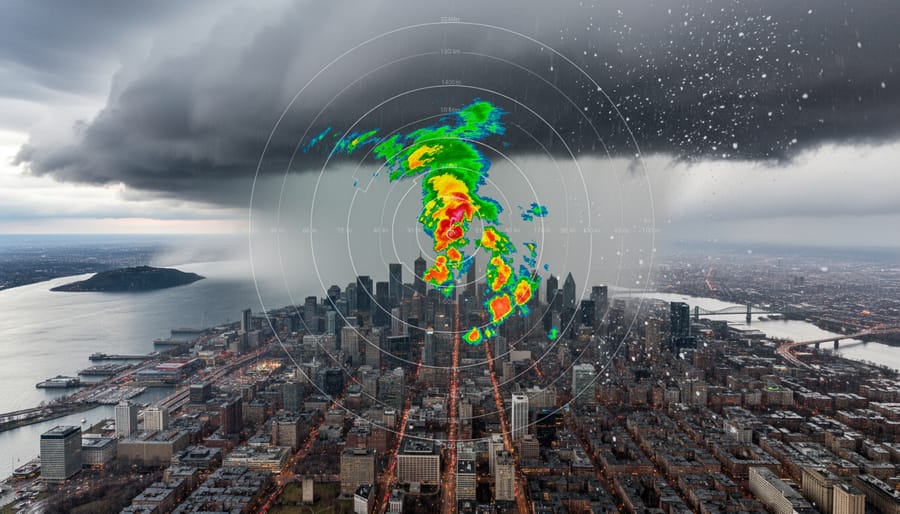
Montreal’s weather radar operates by sending out electromagnetic pulses that travel through the atmosphere until they encounter precipitation particles. When these radar waves strike raindrops, snowflakes, or hailstones, they bounce back to the radar antenna. The system measures how long it takes for each pulse to return and how much energy comes back, which reveals both the distance to the precipitation and its intensity.
This returned energy creates what meteorologists call reflectivity images. Brighter colours on radar displays indicate heavier precipitation, while lighter shades show less intense rainfall or snowfall. The radar completes a full scan by rotating 360 degrees and tilting at different angles, building a three-dimensional picture of where precipitation exists in the sky above Montreal and surrounding areas.
The radar doesn’t just capture a single snapshot. It continuously scans the same regions every few minutes, creating a sequence of images that shows how precipitation moves across the landscape. By comparing successive scans, meteorologists can track the direction and speed of storm systems approaching or moving through Montreal. A line of thunderstorms might appear on the western edge of the radar coverage, then successive images show it marching eastward toward the city.
This movement tracking proves essential for issuing timely warnings. When radar reveals a severe thunderstorm cell advancing toward populated areas at 50 kilometres per hour, forecasters can calculate exactly when it will arrive and alert residents accordingly.
Tracking Wind Patterns Through Doppler Technology
Montreal’s radar doesn’t just show where precipitation is falling, it reveals how fast and in which direction the weather is moving. This capability comes from the Doppler effect, the same principle that makes an ambulance siren sound different as it approaches versus when it drives away. When radar waves bounce off raindrops or snowflakes moving toward or away from the radar site, the frequency of the returning signal shifts slightly. Meteorologists analyze these shifts to create velocity patterns that map wind speed and direction throughout a storm system.
Before 2018, Montreal’s radar could measure these velocity patterns only within 128 km of the site, using three scanning angles. The S-Band radar renewal between 2018 and 2023 nearly doubled that range, expanding full Doppler coverage to 240 km. This upgrade means forecasters can now track how winds are organized inside severe thunderstorms well before they reach the city, identifying rotation that might spawn tornadoes or detecting powerful straight-line winds from approaching squalls.
The velocity data appears as a color-coded map showing areas where precipitation moves toward the radar (typically green) and away from it (usually red). Sharp boundaries between these colors, especially when they curve into a tight couplet, signal intense rotation. Combined with reflectivity data showing precipitation intensity, this wind information gives meteorologists the lead time needed to issue warnings that protect lives and property.
Real-Time Monitoring During Severe Weather
Meteorologists rely on Montreal radar to issue timely warnings when severe weather threatens the region. The system continuously scans the atmosphere, allowing forecasters to track severe weather events such as thunderstorms, tornadoes, and heavy precipitation as they develop and move toward populated areas. During intense storms, velocity data reveals rotating wind patterns that signal potential tornado formation, while reflectivity shows where the heaviest rainfall or hail is concentrated. This real-time information proves critical during Quebec’s volatile summer thunderstorm season and during remnants of tropical systems that occasionally track northward. Forecasters monitor the 240 km Doppler coverage zone to detect rapid changes in wind speed and direction, issuing alerts up to 30 minutes before dangerous conditions arrive. The radar’s ability to track precipitation movement also helps predict flash flood risks in urban Montreal, where storm sewers can quickly overwhelm during sudden downpours.
Components and Capabilities of Montreal’s Radar Network
Reflectivity vs. Velocity Data
Montreal’s weather radar produces two fundamentally different types of measurements, each revealing distinct aspects of a storm. Reflectivity data shows where precipitation is falling and how intense it is, creating the familiar color-coded images that indicate rain, snow, or hail location. The reflectivity range extends to 300 km from the radar site, giving meteorologists a wide view of approaching weather systems across southern Quebec and into neighboring regions.
Velocity data, by contrast, measures how fast precipitation particles are moving toward or away from the radar station, revealing wind patterns within storm systems. This Doppler-derived information is essential for detecting rotation in thunderstorms or tracking how quickly a storm front is advancing. Following the network renewal completed in 2023, Montreal’s radar now provides full Doppler velocity coverage out to 240 km, a substantial improvement from the previous 128 km range at three angles.
Understanding both measurements together gives forecasters the complete picture. Reflectivity tells you what is falling and where, while velocity reveals the wind dynamics driving that precipitation and whether conditions are intensifying or weakening.
The 2018-2023 Network Upgrade
Between 2018 and 2023, Environment and Climate Change Canada completed a comprehensive renewal of its weather radar network, replacing older technology with advanced S-Band radars. This upgrade transformed the capabilities of all 33 radars across the country, including Montreal’s system, significantly expanding both the range and quality of weather detection.
The most immediate benefit was increased coverage. While pre-2018 radars reached 256 km for reflectivity data, showing where precipitation was falling, the new S-Band systems pushed that range to 300 km. That’s an extra 44 kilometres in every direction, capturing weather systems earlier and giving forecasters more lead time to issue warnings.
Even more significant was the expansion of Doppler velocity coverage, which measures wind speed and direction within storms. The old network provided full Doppler data only within 128 km, using three scanning angles to detect movement. The upgraded radars extended full Doppler coverage to 240 km, nearly double the previous range. This means meteorologists can now track how winds are shifting inside severe thunderstorms, identify rotation that might spawn tornadoes, and follow the movement of precipitation bands across a much wider area around Montreal.
For wind energy planning, this upgrade matters. Better velocity data helps identify exactly where and how wind patterns behave during different weather conditions, informing decisions about turbine placement. The longer range also ensures that any potential interference between wind farms and radar systems can be detected and managed across a broader geographic footprint, supporting both accurate weather monitoring and smart renewable energy development.
How Weather Radar Is Used in Montreal
Montreal’s real-time weather radar serves multiple user groups who rely on accurate precipitation and wind data for safety, planning, and operational decisions. Environment and Climate Change Canada makes radar imagery publicly available, allowing anyone to check current conditions or track approaching storms before they arrive.
Meteorologists use radar data every day to build weather forecasts for Montreal and surrounding regions. They analyze reflectivity patterns to predict when rain or snow will begin, how much precipitation will fall, and which areas will see the heaviest accumulations. Velocity data reveals wind speeds and directions within storm systems, helping forecasters identify rotation that could spawn tornadoes or straight-line winds that threaten structures.
Emergency managers and public safety officials monitor radar continuously during severe weather events. When thunderstorms approach, they use reflectivity and velocity patterns to issue timely warnings for specific neighborhoods. During floods, radar helps predict rainfall totals and track storm movement so evacuation orders can target the most vulnerable areas. Aviation authorities rely on radar to route planes around dangerous weather cells and prevent turbulence or icing encounters.
The practical applications of Montreal’s radar network include:
- Daily weather forecasting for temperature, precipitation, and wind predictions
- Severe weather alerts for thunderstorms, tornadoes, and damaging winds
- Flood prediction through rainfall accumulation tracking
- Aviation safety routing around hazardous weather cells
- Emergency management coordination during hurricanes and winter storms
- Renewable energy site planning to minimize wind turbine interference with radar signals
Utilities and transportation agencies check radar before dispatching crews for storm repairs or deciding whether to pre-treat roads with salt. Farmers use precipitation data to time planting and harvesting, while outdoor event organizers monitor approaching cells to protect crowds. The renewable energy sector references radar coverage maps when siting new wind farms, ensuring turbines don’t create blind spots that compromise storm detection for nearby communities.
Weather Radar and Wind Energy: An Important Connection

Weather radar technology and renewable energy infrastructure share an intricate relationship that requires careful coordination. Environment and Climate Change Canada maintains radar visibility maps for turbines showing where wind turbines could be visible to ECCC’s 32 operational weather radars across the country. These maps serve as planning tools because turbines can create interference with radar signals.
Large rotating blades reflect radar beams much like precipitation does, which can create false echoes on radar screens. This phenomenon matters because meteorologists rely on clean data to issue accurate storm warnings and track severe weather. When turbines appear within a radar’s coverage zone, they can produce clutter that obscures real precipitation patterns or makes storms appear more intense than they actually are. The challenge becomes more complex with different wind turbine types as each design produces unique radar signatures.
This doesn’t mean wind farms and weather radar can’t coexist. Strategic wind energy planning considers radar coverage zones during site selection. Developers work with meteorologists to position farms where they minimize interference while still capturing strong wind resources. Some solutions include placing turbines beyond critical detection ranges, using radar-filtering algorithms to distinguish turbines from weather, or coordinating turbine blade positions during severe weather events.
The network renewal from 2018 to 2023 improved this relationship by expanding full Doppler coverage from 128 km to 240 km. The larger coverage area gives planners more flexibility in siting wind farms while maintaining weather detection accuracy. This collaboration between renewable energy development and meteorological infrastructure demonstrates how Canada can advance both storm safety and sustainable power generation without compromising either priority.
Common Questions About Montreal Weather Radar
How does weather radar map precipitation and its movement?
Weather radar sends out radio waves that bounce off precipitation particles like rain, snow, or hail, then measures the returned signal to determine where precipitation is falling and how intense it is. By tracking how these signals change over time, meteorologists can see which direction storms are moving and how fast they’re traveling.
What does weather radar show?
Montreal’s weather radar displays two main types of information: reflectivity data showing the location and intensity of precipitation within a 300 km radius, and velocity data revealing wind speed and direction within storms up to 240 km away. These combined views help forecasters identify everything from light rain showers to severe thunderstorms and tornadoes.
How does weather radar track severe weather events?
The radar’s Doppler technology detects changes in wind patterns that signal dangerous conditions, such as rotating winds within thunderstorms that could spawn tornadoes or rapid shifts in precipitation intensity during hurricanes and floods. Environment and Climate Change Canada’s network of 33 radars across Canada’s most populated regions provides continuous monitoring, with the primary purpose being early detection of precipitation, its motion, and the threat it poses to life and property.
How often is the radar image updated?
Montreal’s weather radar completes a full scan every few minutes, providing near real-time updates during active weather. During severe weather events, meteorologists monitor these continuous updates to issue timely warnings and track rapidly changing conditions.
Beyond these common questions, many people wonder why radar images sometimes show gaps or anomalies. Terrain features like mountains can block the radar beam at low levels, and the curvature of the Earth limits detection of distant low-altitude precipitation. That’s why the 2018-2023 network renewal expanded coverage ranges, the upgraded S-Band radars now detect reflectivity out to 300 km and provide full Doppler velocity data to 240 km, compared to the pre-2018 limits of 256 km and 128 km respectively.
Some users also notice circular patterns or unusual returns on radar images. These can result from ground clutter (buildings, towers, or hills reflecting signals), migrating birds, or even insects on warm summer evenings. Modern radar systems include sophisticated filtering to distinguish actual precipitation from these false returns, though occasionally some clutter makes it through.
If you’re checking Montreal’s radar specifically for wind patterns during storms, focus on the velocity displays rather than just the reflectivity images. The color-coded velocity data shows where winds are moving toward or away from the radar site, making it easier to spot rotation, strong wind shear, or the leading edge of a squall line. Understanding these displays helps you make better decisions about outdoor activities, travel plans, or when to seek shelter during severe weather.
Montreal’s weather radar network stands at the intersection of public safety and environmental responsibility. As severe weather events become more frequent and unpredictable, the 300-kilometer reflectivity range and 240-kilometer Doppler coverage provided by the upgraded S-band system give residents crucial early warnings about approaching storms. This technology saves lives while simultaneously informing smarter decisions about renewable energy infrastructure placement.
Understanding how radar systems work empowers you to make better storm preparedness decisions. Check Montreal’s radar imagery before outdoor activities, monitor approaching precipitation patterns during severe weather warnings, and use velocity data to gauge wind threats. Beyond personal safety, support continued investment in weather monitoring technology that complements rather than conflicts with wind energy development.
The relationship between accurate weather detection and renewable energy planning demonstrates that environmental progress requires integrated thinking. Wind turbines and radar systems can coexist when developers account for potential visibility interference from the start. As Montreal expands its clean energy capacity, advocate for projects that respect the meteorological infrastructure protecting your community. The same data tracking today’s thunderstorm helps planners position tomorrow’s wind farms where they’ll generate maximum power without compromising the radar coverage that keeps everyone safe.