
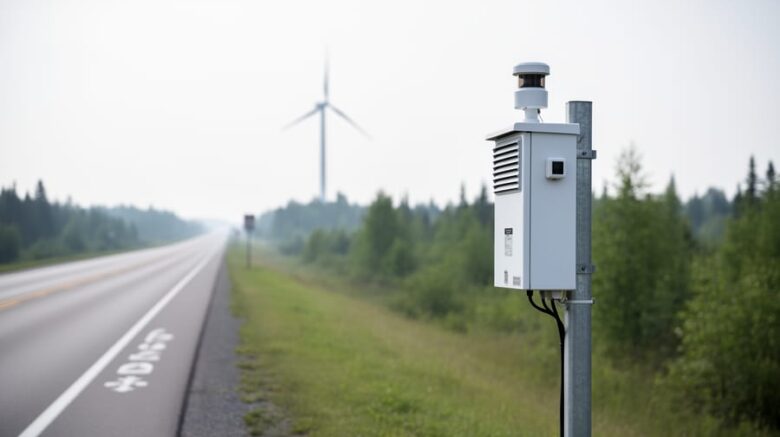
Environment Canada’s Air Quality Health Index (AQHI) provides a real-time scale from 1 to 10+ that translates outdoor air pollution levels into immediate health guidance you can act on today. Whether smoke from distant wildfires is drifting into your region or local traffic emissions are peaking, checking the AQHI takes less than two minutes and tells you exactly when to adjust outdoor activities, close windows, or reschedule that morning run.
The system monitors five key pollutants: fine particulate matter (PM2.5), ground-level ozone, nitrogen dioxide, sulphur dioxide, and volatile organic compounds. Environment and Climate Change Canada partnered with provincial agencies to deploy monitoring stations across the country, with Ontario alone operating 38 real-time stations that feed data into the national network. You’ll find current readings and three-day forecasts posted on both the federal Environment and Climate Change Canada website and provincial air quality portals.
Understanding the AQHI matters because air pollution doesn’t respect geography. Wildfire smoke can travel thousands of kilometres from the burn zone, turning a clear morning in Toronto hazy with particulates generated in northern Quebec or even British Columbia. Children, seniors, and anyone with respiratory conditions face the greatest risk during high-pollution episodes, but even healthy adults notice reduced lung function when the index climbs above 6.
This is where renewable energy enters the picture. Wind turbines generate electricity without combusting fossil fuels, which means they produce zero nitrogen dioxide, sulphur dioxide, or particulate emissions during operation. Every kilowatt-hour generated by wind directly reduces the pollutants that AQHI stations measure. By checking air quality data and supporting clean energy infrastructure, you’re both protecting your immediate health and contributing to cleaner air for your community long-term.
What Environment Canada’s Air Quality System Is
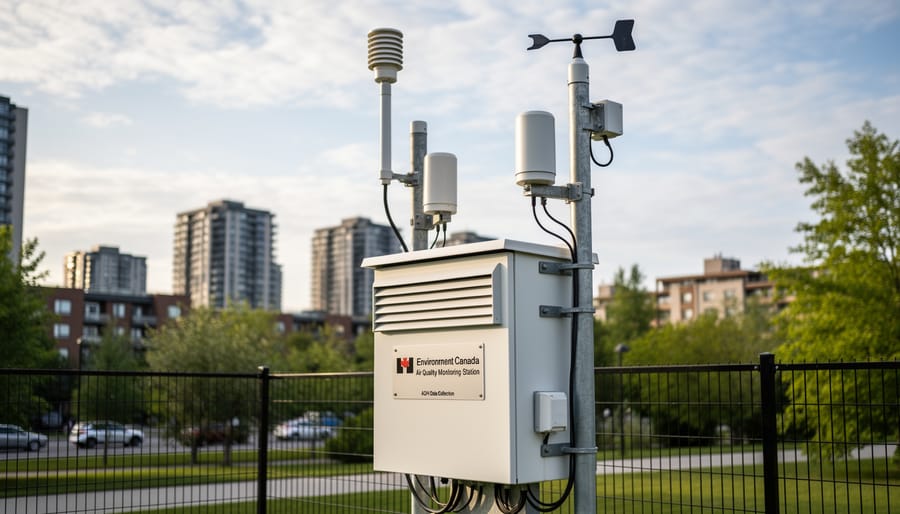
Environment Canada’s air quality monitoring framework gives you real-time access to pollution data that directly affects your health decisions. At the heart of this system sits the Air Quality Health Index, a scale from 1 to 10+ designed to help you understand what the air quality around you means to you and your family. The AQHI was created to help the public understand how outdoor air pollution affects our health, translating complex atmospheric chemistry into practical guidance you can act on immediately.
The monitoring network tracks five key air pollutants that pose the greatest risk to human health: fine particulate matter (PM2.5), ground-level ozone (O3), nitrogen dioxide (NO2), sulphur dioxide (SO2), and volatile organic compounds (VOCs). PM2.5 particles are small enough to penetrate deep into your lungs and bloodstream, while ground-level ozone irritates respiratory tissue on hot, sunny days. NO2 and SO2 primarily come from fossil fuel combustion in vehicles and power plants, and VOCs contribute to smog formation and carry their own health risks.
The design of the monitoring network ensures comprehensive coverage. Ontario alone operates 38 ambient air monitoring stations that collect real-time pollution data across the province, feeding into a national framework managed by Environment and Climate Change Canada. These stations continuously measure ambient levels of the tracked pollutants, building a 15-year dataset that reveals long-term air quality trends alongside the immediate hourly readings you check before heading outdoors.
This system becomes especially critical during events that drastically alter air quality. Wildfire smoke, for instance, may be carried thousands of kilometres from the fire zone and can impact air quality in areas close to and far from the wildfire source. The monitoring network detects these changes as they happen, allowing Environment Canada to issue timely forecasts and health advisories through partnerships with provincial agencies that post AQHI values on both federal and provincial platforms.
Who Can Access Air Quality Data and When You Need It
Environment Canada’s air quality data is fully public and free to access, every Canadian can check the AQHI anytime, whether you live in a major city or a remote community. No registration, subscription, or eligibility criteria stand between you and the information. The system exists to help everyone make safer decisions about outdoor activities based on current pollution levels.
While anyone can use the data, certain groups benefit most from checking AQHI forecasts daily:
- People with asthma, COPD, or other respiratory conditions who experience worsened symptoms during high pollution days
- Outdoor workers such as construction crews, landscapers, and delivery drivers exposed to pollutants throughout their shifts
- Parents planning playground visits or sports practice for children, whose developing lungs are more vulnerable to air pollution
- Athletes and fitness enthusiasts scheduling runs, cycling routes, or outdoor training sessions
- Older adults and individuals with heart disease who face elevated health risks when air quality deteriorates
Beyond routine monitoring, specific circumstances demand closer attention to AQHI readings. Wildfire smoke events create urgent need for daily checks, as wildfire smoke travel thousands of kilometres from the source and degrade air quality in regions nowhere near active fires. A wildfire burning in northern British Columbia can push particulate matter into Ontario within days, turning clear skies hazy and AQHI values dangerously high.
You should also monitor air quality when planning outdoor events like weddings or festivals, during smog advisories in summer heat, and before deciding whether to open windows for natural ventilation. Even if you feel fine, elevated pollutant levels can trigger delayed respiratory reactions or worsen chronic conditions hours after exposure.

How to Access and Check Air Quality Data
Understanding the AQHI Scale and What Each Level Means
The Air Quality Health Index uses a numbered scale where 1 represents the lowest health risk and 10+ indicates the highest. The scale translates complex measurements of five key pollutants, PM2.5, ground-level ozone, nitrogen dioxide, sulphur dioxide, and volatile organic compounds, into a single number that tells you what the outdoor air quality means for your health.
| AQHI Range | Health Risk | At-Risk Individuals | General Population |
|---|---|---|---|
| 1-3 | Low | Enjoy usual outdoor activities | Ideal conditions for any outdoor activity |
| 4-6 | Moderate | Consider reducing intense outdoor activities if experiencing symptoms | No need to modify activities |
| 7-10 | High | Reduce or reschedule strenuous outdoor activities | Consider reducing intense activities if experiencing symptoms |
| 10+ | Very High | Avoid strenuous outdoor activities | Reduce or reschedule strenuous activities, especially outdoors |
At-risk individuals include people with asthma, heart disease, chronic obstructive pulmonary disease, diabetes, and pregnant women. Children and older adults also face higher sensitivity to poor air quality. During wildfire smoke events, the AQHI can spike quickly because smoke travels thousands of kilometres from fire zones, affecting regions far from the source.
Understanding the relationship between AQHI and wind patterns helps explain why readings fluctuate throughout the day. Check the AQHI before planning outdoor exercise, yard work, or children’s activities, and adjust your plans when readings reach moderate or higher levels.
Your Rights to Air Quality Information and Public Health Protection
As a Canadian, you have the legal right to access timely, accurate air quality information at no cost. Environment and Climate Change Canada is required to publish current AQHI values, forecasts, and health advisories for communities across the country. This isn’t a courtesy, it’s a public health obligation built into the system’s design.
The government must maintain a functioning network of monitoring stations and ensure that data reaches you quickly enough to inform daily decisions. Provincial partners like Ontario’s Ministry of the Environment operate their own stations and share real-time readings through coordinated platforms. When air quality deteriorates due to wildfires, industrial emissions, or weather patterns, you’re entitled to prompt warnings that explain the health risk and recommend protective actions.
You also have access to long-term transparency. The federal government tracks 15-year pollutant trends for five key contaminants: PM2.5, O3, NO2, SO2, and VOCs. These indicators let you see whether outdoor air pollution is improving or worsening in your region over time, helping you understand whether collective efforts, including renewable energy adoption, are making a measurable difference.
If a monitoring station fails or data isn’t updated, you can contact Environment and Climate Change Canada directly to report the issue. Accountability matters: accurate air quality information protects vulnerable populations, guides outdoor activity planning, and supports informed decisions about where to live and work.
How Wind Energy and Renewable Sources Improve Air Quality Monitoring Results
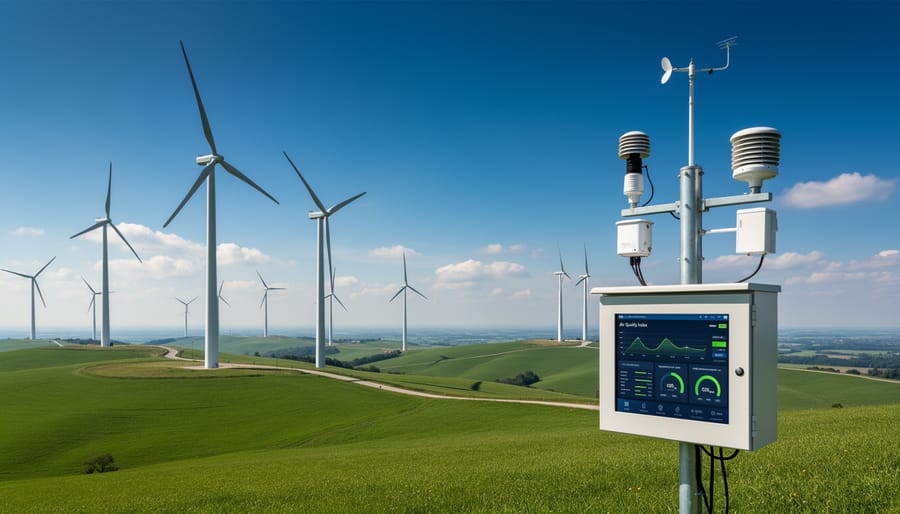
Wind turbines and solar installations do more than generate electricity, they directly reduce the pollutants that Environment Canada’s monitoring stations measure. Every kilowatt-hour from renewable sources displaces fossil fuel generation, cutting emissions of PM2.5, NO2, SO2, and VOCs at the source before they reach the air you breathe. When a coal or natural gas plant throttles back because wind farms are feeding the grid, monitoring stations record lower concentrations of these five key pollutants, which feed into the AQHI calculation.
Real-world impacts are measurable. In Ontario, where 38 ambient air monitoring stations track pollution in real time, the expansion of wind capacity has coincided with declining NO2 and SO2 levels since coal plants shut down. PM2.5 concentrations drop when wind and solar replace diesel generators in remote communities, and VOC emissions fall as renewable electricity powers transportation and industry. Ground-level ozone, which forms from reactions involving NO2 and VOCs, also decreases when those precursor pollutants decline.
This creates a feedback loop: as wind energy benefits include cleaner air, monitoring stations capture the improvement, AQHI forecasts reflect lower health risks, and Canadians see tangible proof that renewable energy adoption works. When you check the Local Air Quality Health Index page and see a lower number, part of that progress comes from the wind turbines spinning in Ontario, Alberta, and Quebec, reducing emissions one megawatt at a time.
Where to Get Help and Additional Resources
Environment and Climate Change Canada’s Local Air Quality Health Index page serves as your primary federal resource for current AQHI forecasts and air pollution data across Canadian cities. For regional monitoring, provincial systems provide more granular information, Ontario residents can access Air Quality Ontario, which displays real-time data from 38 ambient monitoring stations throughout the province and posts AQHI values in partnership with the federal government.
Mobile apps from provincial environmental agencies deliver push notifications during poor air quality events, making it easier to stay informed when pollution levels spike or wildfire smoke drifts into your area. These tools often include customizable alerts based on your health sensitivity and location.
To explore long-term pollution patterns, Environment and Climate Change Canada tracks 15-year trends in five key pollutants: PM2.5, ground-level ozone, nitrogen dioxide, sulphur dioxide, and volatile organic compounds. This historical data helps you understand whether air quality in your region is improving or deteriorating over time.
Contact your local environmental agency directly for questions about specific monitoring stations, interpretation of unusual readings, or community-level air quality concerns they can address with targeted expertise.
How to Apply or Complete the Process
Environment Canada’s air quality monitoring system operates as a public information service rather than a program requiring application or enrollment. You don’t need to register, submit forms, or complete any administrative process to access AQHI data and air quality forecasts.
Access is immediate and automatic for all Canadians. Simply visit the Environment and Climate Change Canada website and navigate to the Local Air Quality Health Index page, where you’ll find current readings and forecasts for Canadian cities. No account creation, verification, or approval steps are necessary.
For provincial data in Ontario, the Ministry of the Environment, Conservation and Parks provides real-time information from its 38 ambient monitoring stations through the Air Quality Ontario website. Again, no registration is required, the data is publicly available.
If you want automated alerts during poor air quality events, check whether your provincial environmental agency offers email or SMS notification services. Some provinces provide opt-in alert systems that require only your postal code and contact information.
The only “process” involved is making air quality monitoring part of your routine: check AQHI forecasts before outdoor activities, especially if you have respiratory conditions, and bookmark the relevant federal or provincial pages for quick access during wildfire smoke events or high pollution days.
Frequently Asked Questions
What is the Air Quality Health Index (AQHI)?
The AQHI is a scale from 1 to 10+ designed to help you understand what the air quality around you means to you and your health. It was created to help the public understand how outdoor air pollution affects our health, translating complex data into practical guidance for daily activities.
How do I check air quality during wildfire smoke events?
Visit Environment and Climate Change Canada’s Local Air Quality Health Index page for current AQHI forecasts for Canadian cities. Provincial partners like Ontario’s Air Quality Ontario page also provide real-time data from monitoring stations. Remember that wildfire smoke can travel thousands of kilometres and impact areas far from the fire zone, so check regularly even if fires seem distant.
What does each level on the AQHI scale mean?
The scale runs from 1 (low health risk) to 10+ (very high health risk), with higher numbers indicating greater concern for sensitive populations and the general public. Each level comes with specific health guidance about outdoor activities and precautions you should take.
How many air monitoring stations operate in Ontario?
Ontario’s Ministry of the Environment, Conservation and Parks maintains a network of 38 ambient monitoring stations across the province that collect real-time air pollution data. These stations feed into both provincial and federal reporting systems through a partnership with Environment and Climate Change Canada.
Which pollutants does Environment Canada track for air quality trends?
Environment and Climate Change Canada tracks five key air pollutants over 15-year periods: fine particulate matter (PM2.5), ground-level ozone (O3), nitrogen dioxide (NO2), sulphur dioxide (SO2), and volatile organic compounds (VOCs). These pollutants form the basis for measuring both average and peak ambient air quality levels across Canada.
These questions reflect what most Canadians want to know when they search for air quality information, particularly during pollution events or when planning outdoor activities. If you have respiratory conditions, work outdoors, or care for children or elderly family members, bookmarking the official monitoring pages gives you quick access to the data you need. The federal and provincial partnership ensures you can find consistent, reliable information whether you start your search at the national or regional level, with real-time updates from dozens of monitoring stations translating pollution levels into actionable health guidance.
Monitoring air quality is not just about checking numbers, it is about taking control of your health and making informed decisions every day. Whether you are planning outdoor activities, managing a respiratory condition, or simply protecting your family, regular AQHI checks give you the real-time information you need to stay safe. Environment Canada’s monitoring system provides transparent data on the five key pollutants affecting Canadian air, empowering you to respond quickly during poor air quality events.
Your daily choices matter. By supporting renewable energy adoption and conservation efforts, you directly contribute to reducing the emissions that monitoring stations track. Every wind turbine installed, every solar panel activated, and every energy-efficient upgrade helps lower the PM2.5, nitrogen dioxide, and sulphur dioxide levels that impact the AQHI readings in your community. This creates a positive cycle: cleaner energy means cleaner air, which means better health outcomes for everyone.
Check the AQHI regularly at Environment and Climate Change Canada’s website, especially during wildfire season or high pollution days. Advocate for clean energy projects in your area, reduce your own energy consumption, and encourage others to do the same. The air quality we monitor today reflects the energy decisions we made yesterday, make tomorrow’s readings better.